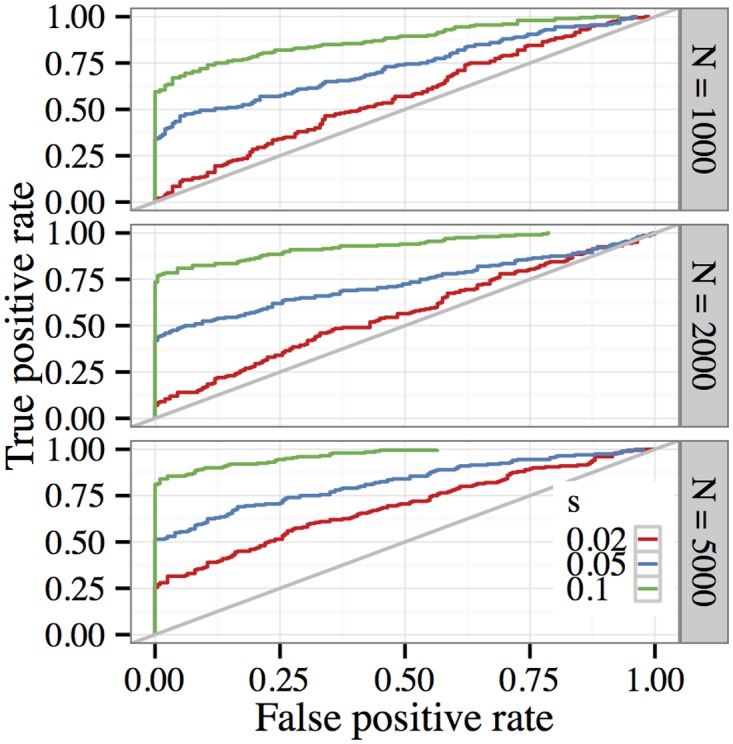
Fig 2. Receiver operating characteristics when testing for selection in E&R experiments with larger population sizes.

Parameters for each simulation were the same as in Fig. 1, except that the population size was increased to N = 2000 (middle panel) and N = 5000 (bottom panel). Comparing these ROC curves with those in Fig. 1, we see that increasing the population size by only a few folds significantly improves the performance of the test for selection.
