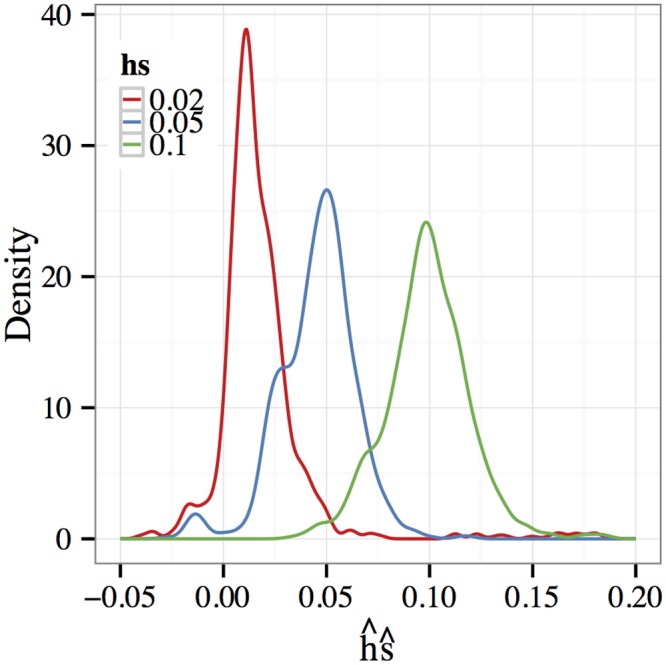
Fig 4. Overdominance estimation.

Density estimates of the product when the parameters are estimated jointly. The selection coefficient was fixed at s = 0.01 while the dominance parameter h was varied. In each simulation, the initial allelic frequency was restricted to lie outside the interval [0.4, 0.6] (see discussion in text). The mean of is quite close to the true value hs and the distribution is tightly concentrated around that value.
