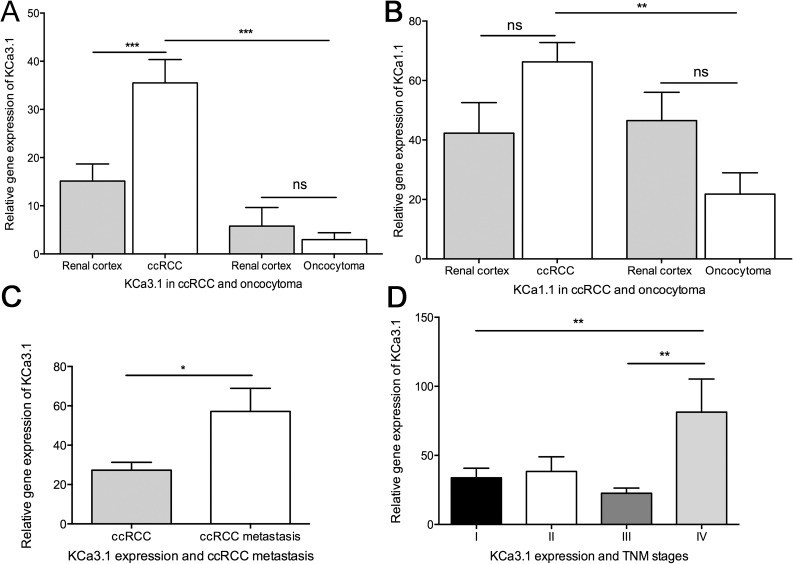
Fig 1. Quantitative RT-PCR analysis of KCa3.1 and KCa1.1 mRNA in oncocytoma and ccRCC together with paired normal renal cortex.
Mean + SEM is shown. KCa3.1 gene expression is shown relative to reference gene expression of multiple reference genes and KCa1.1 gene expression relative to reference gene TBP. A) Comparison of KCa3.1 gene expression in tumor tissue from oncocytoma and ccRCC together with paired unaffected renal cortex, B) Comparison of KCa1.1 gene expression in tumor tissue from oncocytoma and ccRCC together with paired unaffected renal cortex C) KCa3.1 gene expression in ccRCC tumors with and without metastasis, D) Comparison of KCa3.1 gene expression in different TNM stages of ccRCC. *p < 0.05, **p< 0.01 ***p < 0.001. ns = non-significant.

