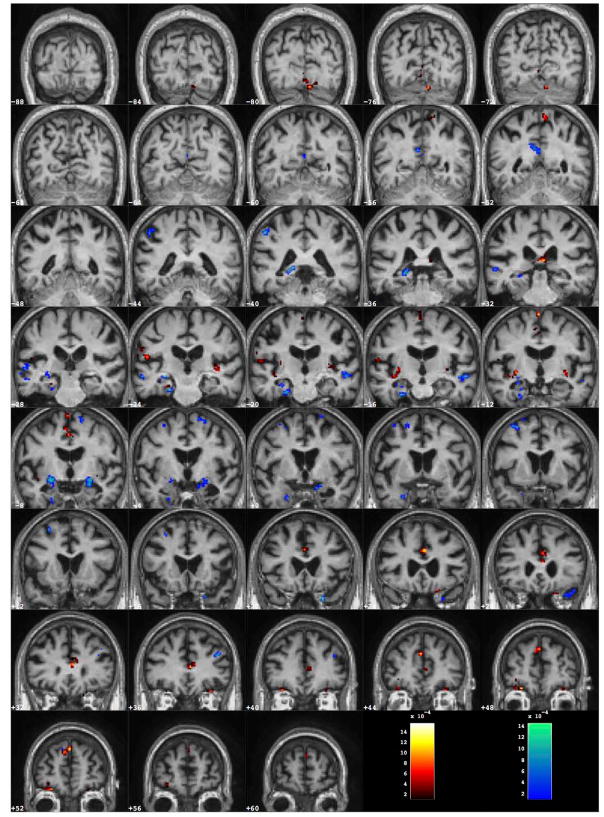
Figure 5.
Average discrimination map obtained by training on the AD/CTRL data with the 6000 top ranking SVM weights wi. The corresponding discrimination average performance is AUC = (87.1±0.6)% in 20f-CV repeated ten times on AD/CTRL data, and AUC = (70.7±0.9)% in independent validation on the MCI-C/MCI-NC cohort.

