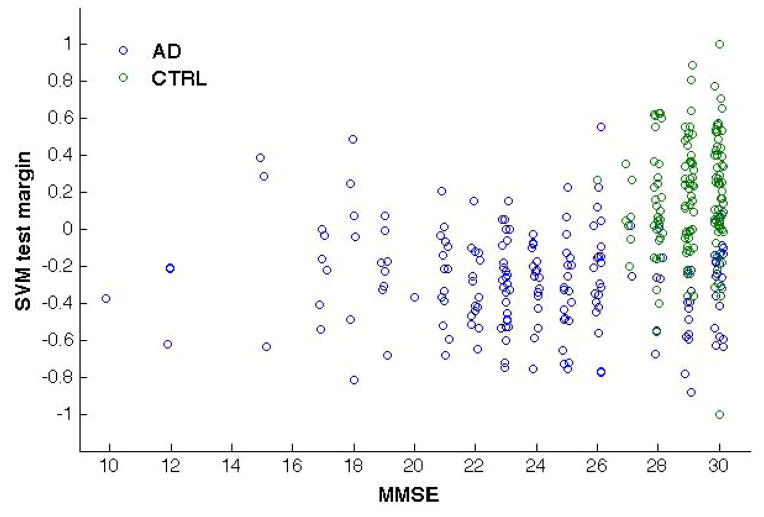
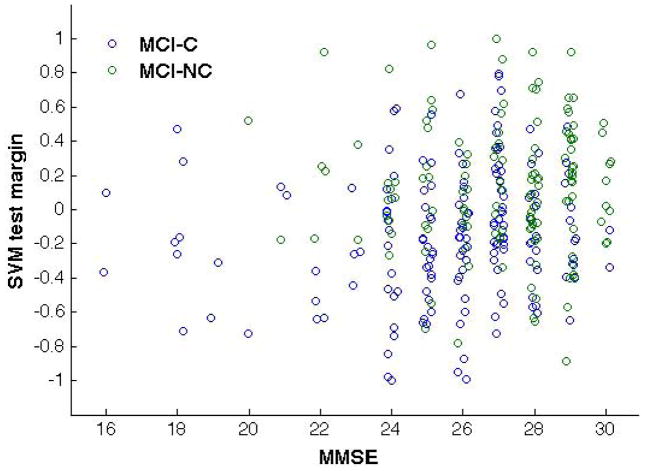
Figure 6.
Scatter plots reporting the MMSE score and SVM test margin obtained with SVM trained on AD/CTRL data: AD vs. CTRL (left) and validation on MCI-C vs. MCI-NC sample (right). A small noise term has been added to the MMSE score of each subject to make the distributions more visible. The results obtained in one representative out of ten repetitions of the SVM classification are shown.


