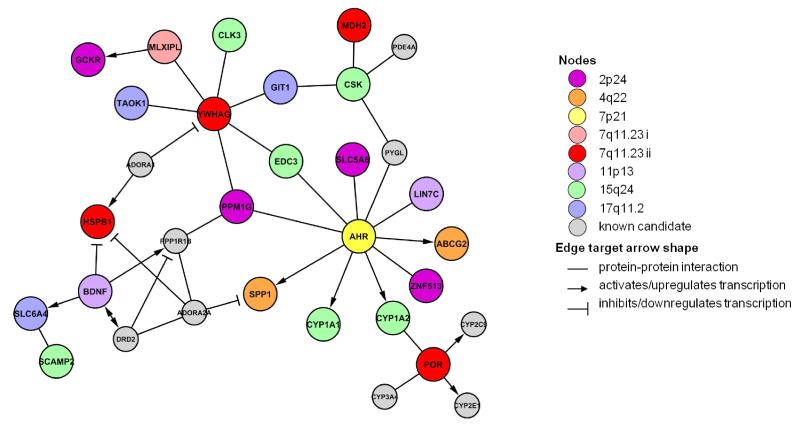
Figure 1.
Network describing direct interactions between candidate genes of confirmed loci. Relationships were retrieved from databases of transcription regulation and protein-protein interaction experiments (Supplementary Table S21). Genes are represented as nodes that are colored according to locus. Candidate genes for loci identified in the current study were supplemented with known candidate genes related to caffeine pharmacology (grey nodes). Edges indicate known interactions.

