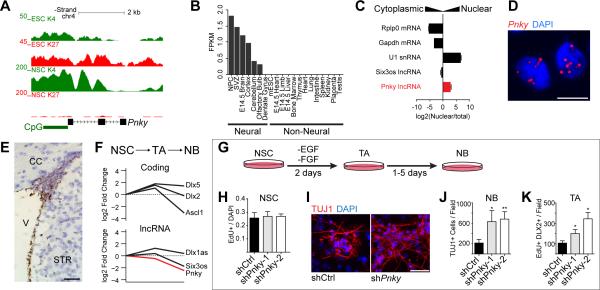
Figure 1. The lncRNA Pinky is expressed in SVZ-NSCs and regulates neuronal differentiation.
A) UCSC genome browser view of the Pnky locus. Also shown are ChIP-seq tracks for H3K4me3 and H3K27me3 in ESCs and V-SVZ NSCs. B) Fragments per kilobase per million mapped reads (FPKM) values for Pnky in indicated tissues. C) Subcellular fractionation followed by RT-qPCR for indicated lncRNAs and mRNAs. Error bars are propagated standard deviation (S.D.) from technical triplicate wells. D) Branched-DNA ISH for Pnky in V-SVZ NSC cultures. Nuclei are counter-stained with 4',6-diamidino-2-phenylindole (DAPI). Scale bar = 10 μm. E) Branched-DNA ISH for Pnky (brown) in adult mouse coronal brain section. Nuclei are counter-stained with hematoxylin. V = ventricle, CC = corpus collosum, STR = striatum. Scale bar = 50 μm. F) Microarray expression analysis from FACS-isolated neural stem cells (NSC), transit-amplifying cells (TA), and neuroblasts (NB). Value in NSCs set to 0. G) Schematic of V-SVZ NSC culture system. H) Quantification of EdU labeling counted from GFP+ cultures of V-SVZ NSCs infected with control or Pnky-KD constructs. I) ICC for TUJ1 (red) after 7d of differentiation in control or Pnky-KD GFP+ cultures. Nuclei are counter-stained with DAPI (blue). Scale bar = 50 μm. J) Quantification of TUJ1+ NBs produced after 7d differentiation. K) Quantification of the number of TA cells after 2d of differentiation. Error bars for H, J, and K are S.D. from triplicate wells, * p < 0.05, **p < 0.01, Student's t-test. See also Figure S1.

