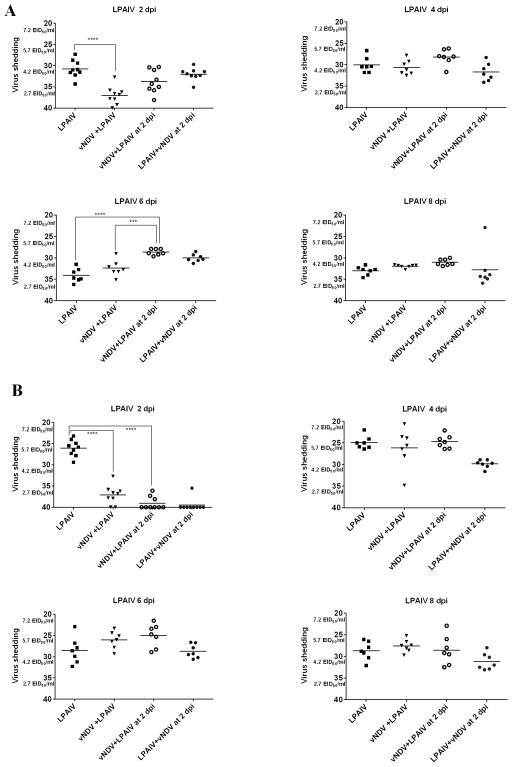
Fig. 2.
LPAIV OP (A) and CL (B) shedding in ducks. Mean Ct values and equivalent EID50/ml titers of AIV detected in OP swabs at different time points after inoculation. In groups sequentially infected, the days post-inoculation (dpi) is based on the last virus given. Significant difference for number of positive ducks by qRT-PCR compared to single virus infected groups, (*** P <0.001; **** P<0.0001).

