. Author manuscript; available in PMC: 2016 May 1.
Published in final edited form as: Methods. 2015 Feb 16;0:125–135. doi: 10.1016/j.ymeth.2015.02.004

Figure 2.

Figure 2

Figure 2

Figure 2

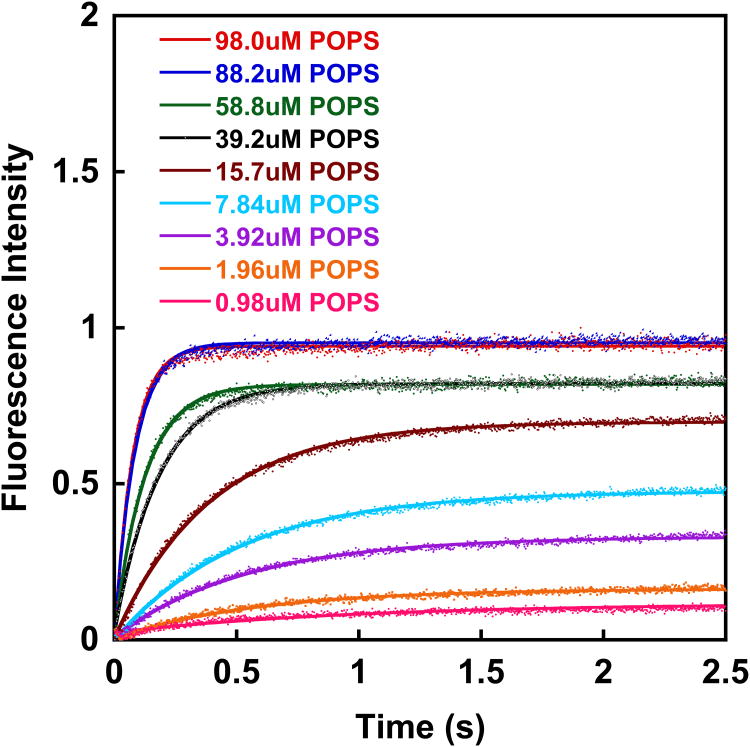
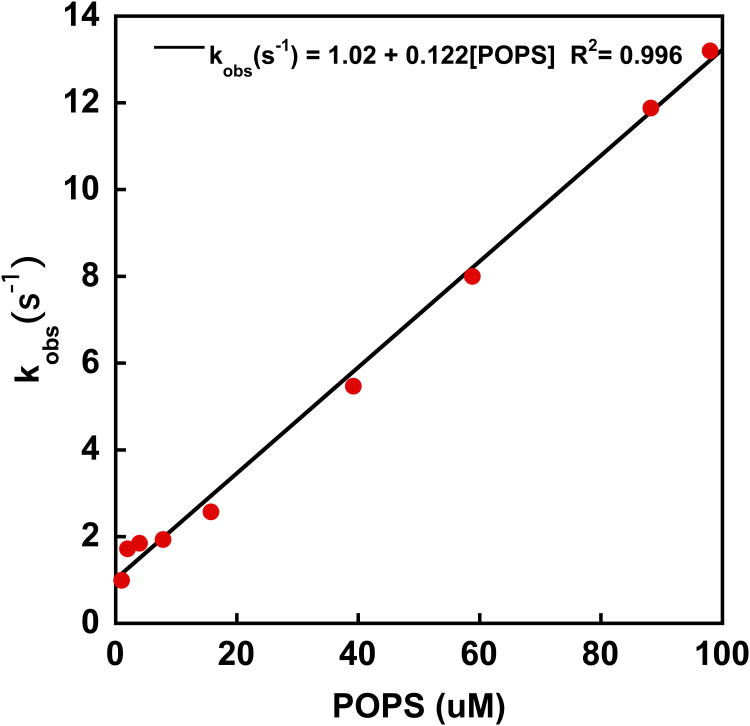
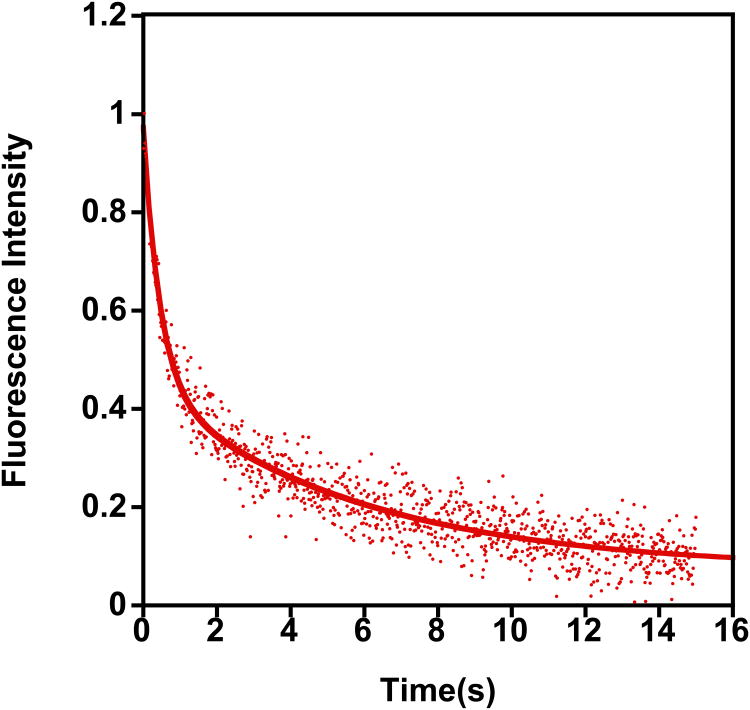
Kinetics of PTEN binding to lipid vesicles. (A) Time dependent increase of dansyl-PE fluorescence intensity for the association of wt PTEN with different concentrations of 100 nm unilamellar vesicles composed of 98% POPS/2% dansyl-PE. Buffer: 150 mM NaCl, 10 mM Hepes, 0.1 mM EDTA, 1 mM DTT. T=20°C. (B) Observed rate constant kobs as a function of POPS concentration. The rate constant kobs is obtained by using equation (1) to fit the time dependent fluorescence intensities (Figure 2A) for the respective lipid concentrations. The slope of the line is kon. (C) Time dependent decrease of dansyl-PE fluorescence intensity for the dissociation of wt PTEN from labeled unilamellar vesicles composed of 98% POPS/2% dansyl-PE. The PTEN/labeled vesicle complex is mixed with a 20 fold excess of unlabeled POPS (100%) vesicles. Buffer: 150 mM NaCl, 10 mM Hepes, 0.1 mM EDTA, 1 mM DTT, T=20°C. The data were fitted with the equation
F=Fmina1ekoff1ta2ekoff2t
koff1= 0.17 s-1; koff2= 2.2s-1. The process associated with koff2 is a very slow process leading to a decline of the fluorescence intensity over a time period of more than 1000s. We attribute this intensity decrease to a settling of the vesicles. koff1 is the rate constant associated with the dissociation of PTEN.