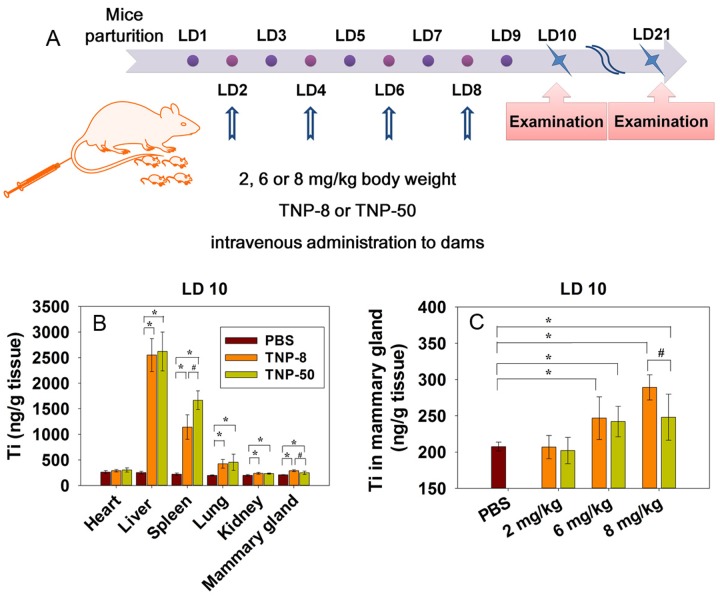
Fig 2. TNP exposure scheme and biodistribution of TNPs in lactating dams after intravenous injection.
(A) TNP exposure scheme. Lactating dams received exposure of TNP-8 or TNP-50 at lactation day (LD) 2, 4, 6, and 8 at a dose of 2, 6 or 8 mg/kg body weight via intravenous administration. (B) Ti content in major organs of lactating dams at LD 10 after four doses of TNPs (8 mg/kg) at LD 2, 4, 6 and 8. Ti content in PBS group showed the basal Ti level in various organs. (C) Ti content in mammary glands at LD 10 after dams were exposed to four doses of TNPs at indicated doses at LD 2, 4, 6 and 8. The symbol * represents significant difference from the PBS group (P<0.05) and # represents significant difference from the TNP-8 group (P<0.05). In both B and C, data are mean±s.d. (n = 7 per group).

