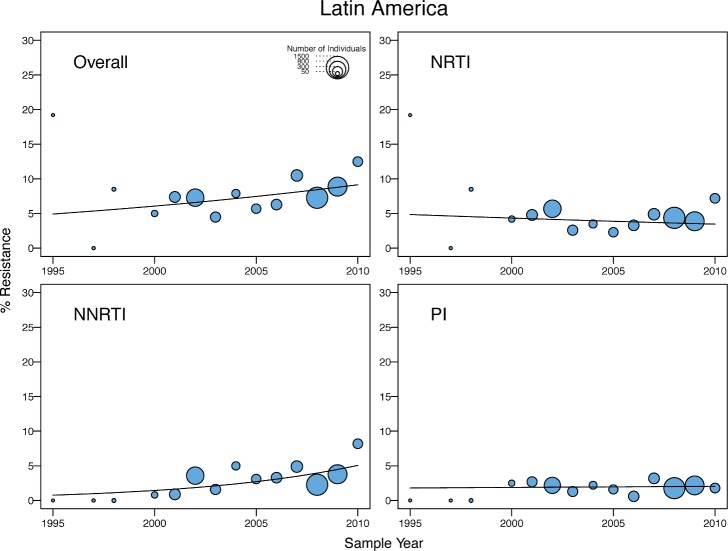
Fig 5. Temporal trends in the yearly proportion of individuals having one or more surveillance drug-resistance mutations in Latin America/Caribbean.
The x-axes represent the calendar year of the sample. The diameter of each circle is proportional to the number of samples sequenced that year. The fitted line shows the fixed effect of sample year in generalized linear mixed model regression.

