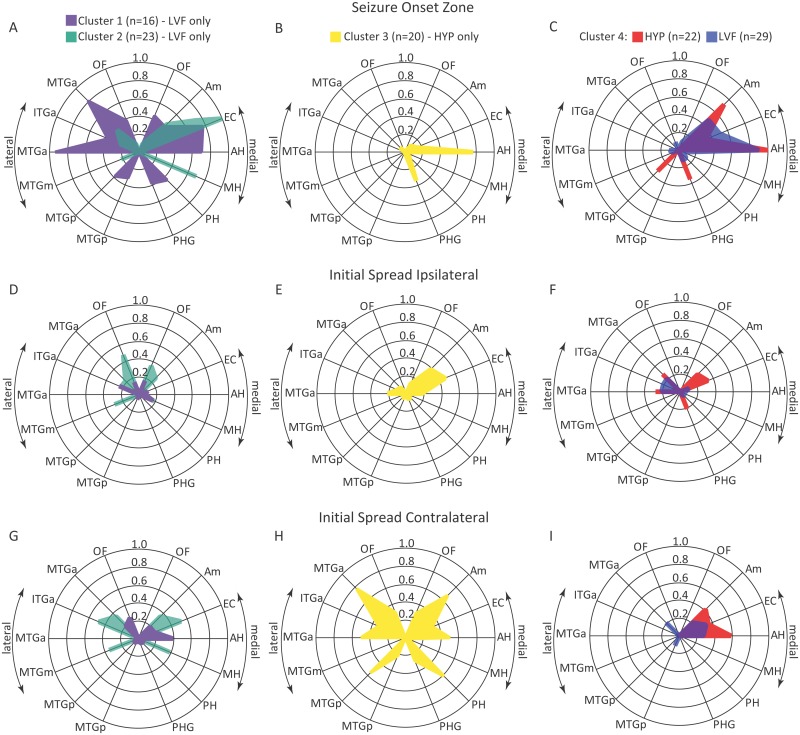
Fig 2. Radar plot illustrating the results of cluster analysis using anatomical /electrode sites(s) of the SOZ and initial seizure spread.
Involvement of each recording site (denoted by radii on each plot) in the SOZ (top row A-C), sites of initial ipsilateral spread (middle row D-F) and initial contralateral spread (bottom row G-I) is expressed as the proportion of total seizures in each cluster (n) indicated by the concentric circles in each plot. Right and left halves of each plot depict medial and lateral aspects respectively of temporal and frontal lobe that included orbitofrontal (OF), amygdala (Am), entorhinal cortex (EC), anterior (AH), middle (MH) and posterior hippocampus (PH), parahippocampal gyrus (PHG), and anterior (a), middle (m), and posterior (p) regions of inferior (ITG) and middle temporal gyri (MTG).

