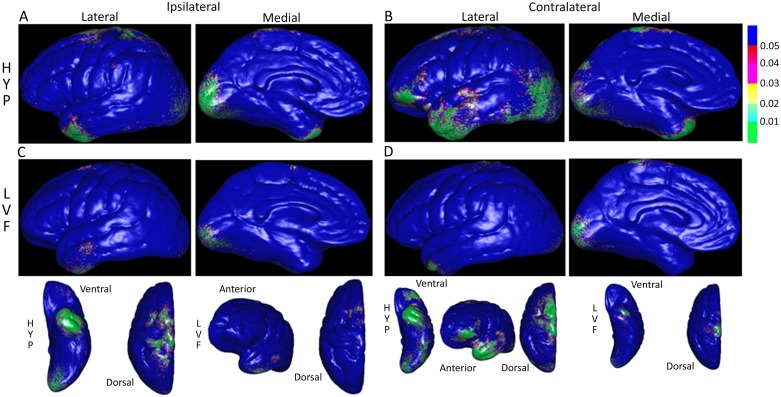
Fig 3. Color-coded probability or P-maps depicting the spatial pattern of significantly reduced gray matter thickness in patients with respect to controls.
Lateral and medial views of cerebral hemisphere ipsilateral (A & C) and contralateral (B & D) to the SOZ in patients with hypersynchronous (HYP, top row) versus patients with low voltage fast (LVF, bottom row) onset seizures. P-maps in bottom row are the same as in rows above, but reoriented to more clearly show gray matter thickness changes on ventral, dorsal, and anterior aspects. In upper right, P-values scaled such that areas shaded green correspond to P<0.01 and blue P>0.05 (not significant).

