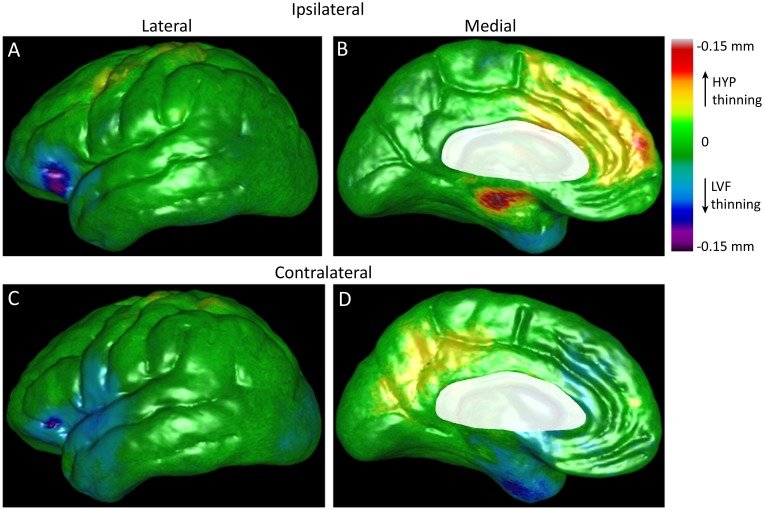
Fig 5. Beta maps illustrating the magnitude of the interaction between ictal EEG onset pattern and epilepsy duration on cortical gray matter thickness after controlling for age and gender.
Lateral (left column) and medial surfaces (right column) of cerebral hemisphere ipsilateral (top row) and contralateral to the SOZ (bottom row). Cortical areas colored yellow, orange, and red indicate thinner GM (in mm) per year of epilepsy in patients with HYP onset seizures, whereas areas colored blue, indigo, and violet correspond to reduced GM per year of epilepsy in patients with LVF onset seizures. Shades of green depict areas of minimal or no thinning per year of disease (color-coded scale upper right corner). Permutation tests correcting for multiple comparisons were significant (ipsilateral: p = 0.037, contralateral: p = 0.037). Areas masked in white are brain areas not applicable for this analysis.

