
Fig 2. Genes induced or repressed in different tissues at early and late timepoints after F. oxysporum infection.
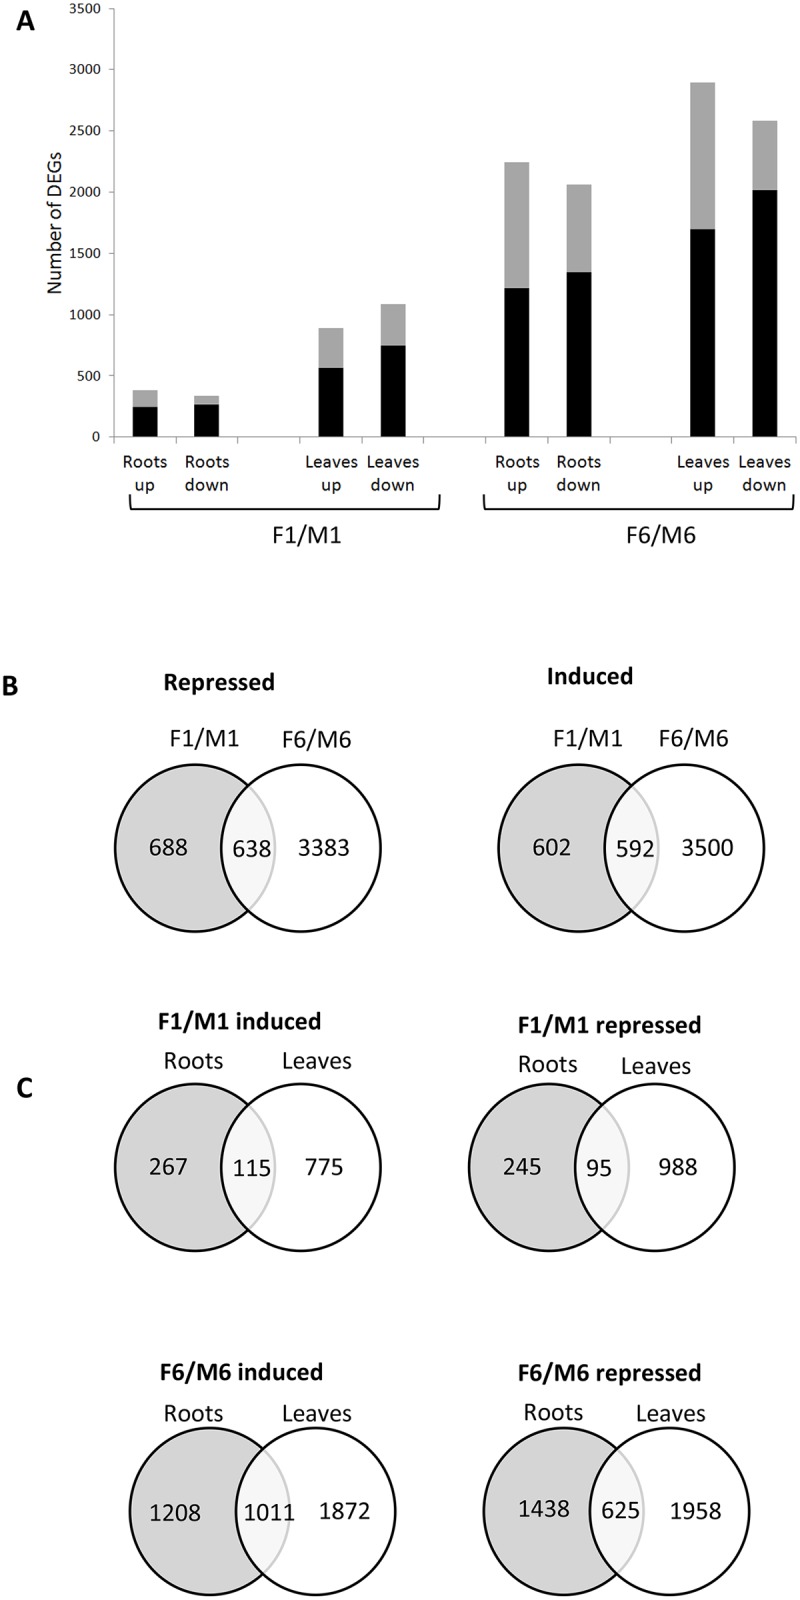
(A) The number of genes induced (up) or repressed (down) by F. oxysporum in roots and leaves at 1 or 6 dpi. Black bars represent genes regulated <2 fold; grey bars represent genes regulated > 2 fold. (B) Overlap in F. oxysporum—responsive genes between two timepoints, 1 (F1/M1) and 6 dpi (F6/M6). (C) Overlap in F. oxysporum—responsive genes between roots and leaves.