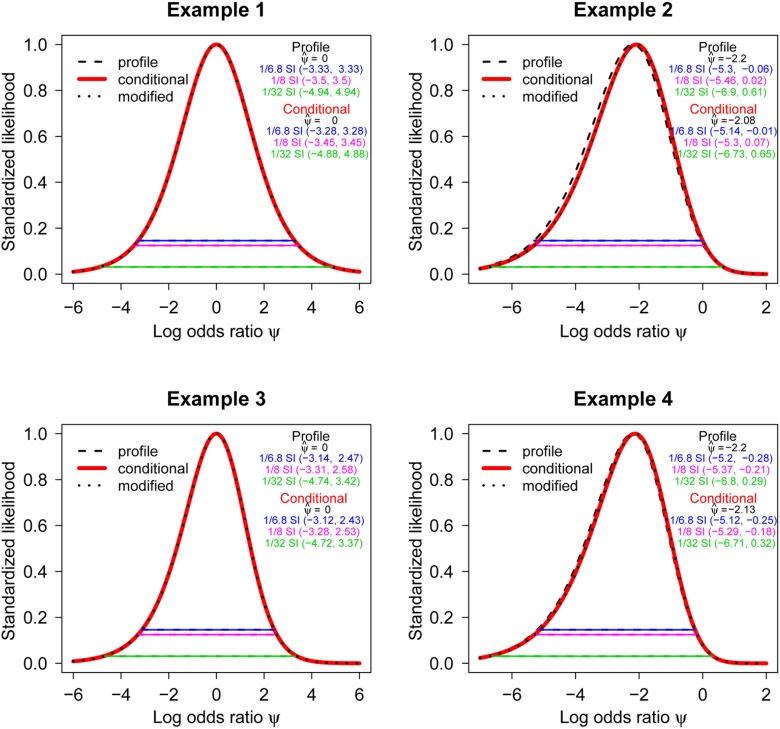
Fig 5. The standardized conditional, modified profile, and profile likelihood functions are depicted for the log odds ratio ψ using the data in Fig. 1, Fig. 2, Fig. 3 and Fig. 4.
The example numbers in this figure correspond to the examples described in Figs. 1–4. The profile likelihood is represented by a dashed black line, while the conditional and modified profile likelihoods are represented by thick red and black dotted lines, respectively. The horizontal lines represent 1/6.8 (upper), 1/8 (middle) and 1/32 (lower) likelihood support intervals (SIs). The maximum likelihood estimate (MLE) of each likelihood was also shown. For normally distributed data, a 1/6.8 SI and a Frequentist 95% confidence interval are identical. Note that the modified profile and conditional likelihoods are indistinguishable for all examples, while the profile and conditional likelihoods are similar for the examples of the null (i.e., ψ = 0 in Examples 1 & 3). In these two examples, the profile likelihood is not visible because it is overlain by the conditional likelihood.

