. 2015 Spring;6(1):e56–e63. doi: 10.2500/ar.2015.6.0109
Copyright © 2015, OceanSide Publications, Inc., U.S.A.
This publication is provided under the terms of the Creative Commons Public License ("CCPL" or "License"), in attribution 3.0 unported (Attribution Non-Commercial No Derivatives (CC BY-NC-ND)), further described at: http://creativecommons.org/licenses/by-nc-nd/3.0/legalcode. The work is protected by copyright and/or other applicable law. Any use of the work other then as authorized under this license or copyright law is prohibited.
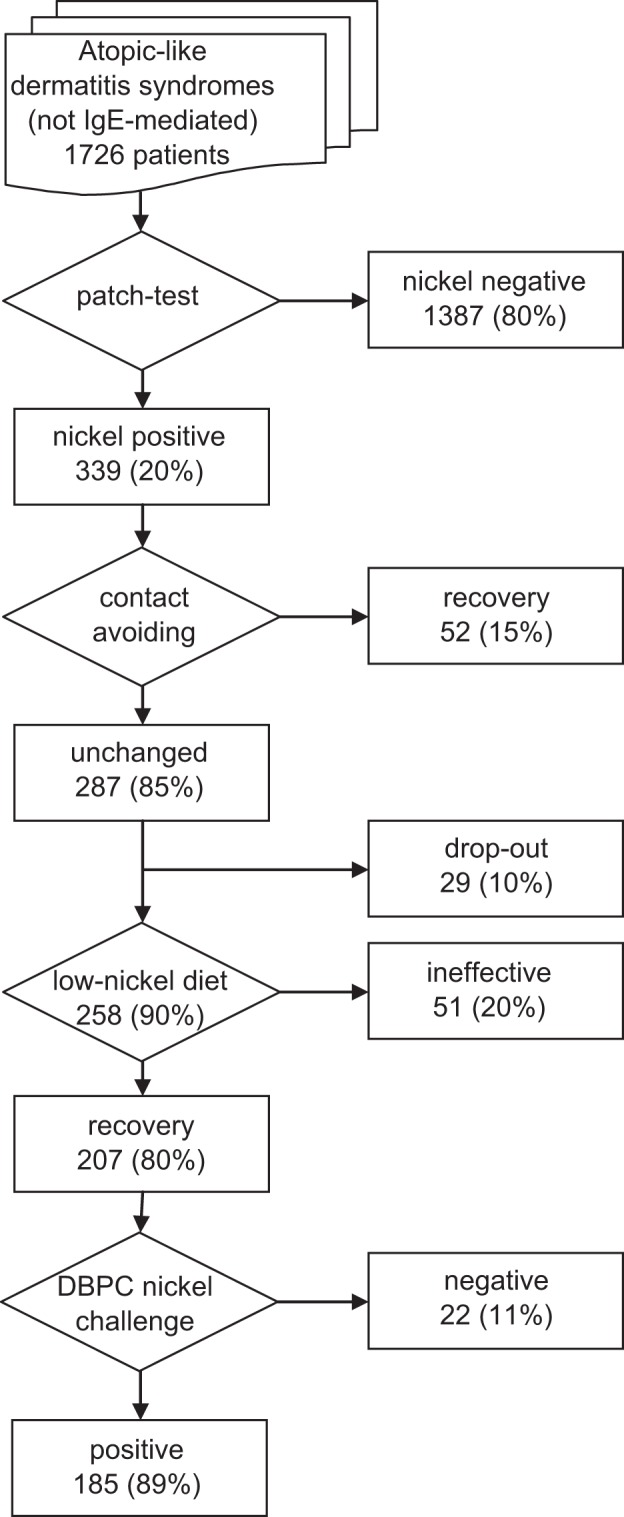
Figure 1.

Flowchart of the study and summary of the results.
