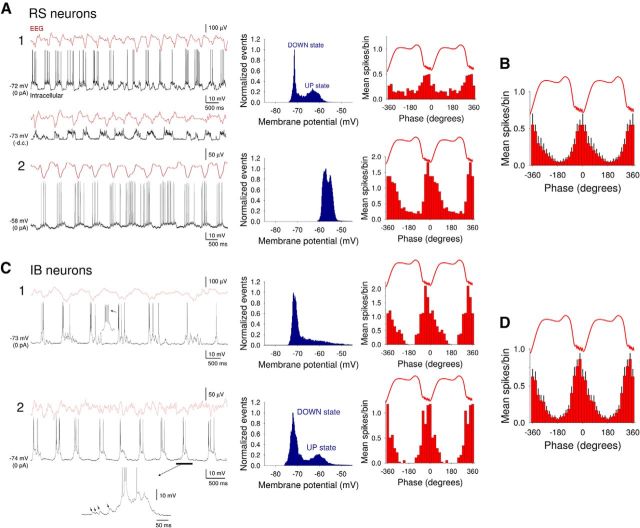
Figure 1.
Recordings of the slow (<1 Hz) oscillation and corresponding UP and DOWN states from layer 5 of the auditory cortex in the anesthetized mouse. A, Simultaneous EEG and intracellular recordings from two RS neurons showing representative examples of UP and DOWN states from neurons where membrane potential is distributed bimodally (A1) and nonbimodally (A2). The corresponding membrane potential distributions are shown to the immediate right (blue plots), whereas the related spike timing histograms (red bars) are plotted on the far right. Hyperpolarization of the neuron in A1 to prevent action potential firing (bottom trace, −d.c.) reveals barrages of synaptic activity during UP states. The UP states in the RS neuron depicted in A2 emerge from a relatively depolarized membrane potential baseline. B, Average spike timing histogram (mean ± SEM) computed from 12 RS neurons. C, Simultaneous EEG and intracellular recordings from two different IB neurons. UP states arise consistently from a hyperpolarized membrane potential baseline and always commence with a burst of action potentials. The corresponding membrane potential distributions are shown to the immediate right (blue plots), whereas the related spike timing histograms (red bars) are plotted on the far right. D, Average spike timing histogram computed from 12 IB neurons.

