
Figure 3.
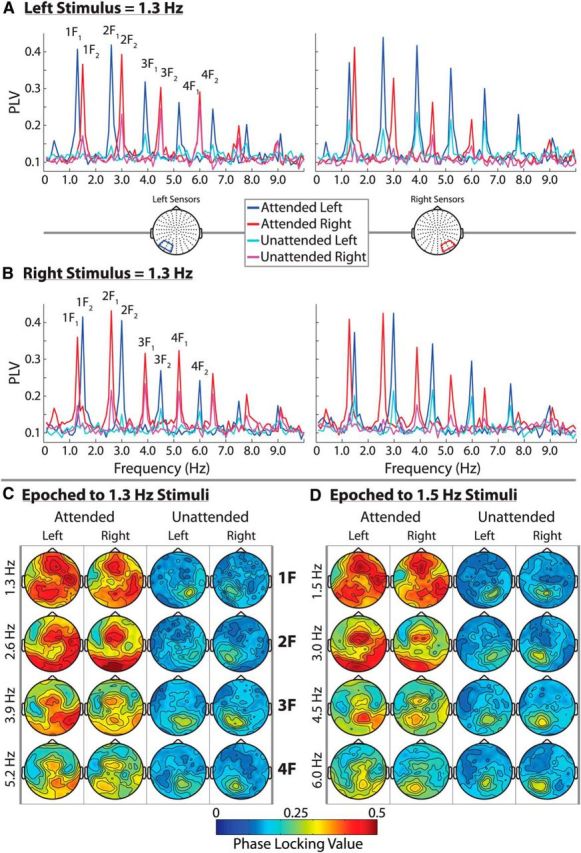
Spectral and topographical distribution of the entrainment response. A and B show average phase-locking spectra at left and right occipital sensor groups for the two stimulus configurations; 0.1–10 Hz PLVs are shown. Strong attentional modulation can be seen over both sensor groups at the frequency of the attended checkerboard stream (1F) as well as at several higher harmonics (2F–4F). The attended and unattended signals were obtained by segmenting the data according to the attended and unattended targets, respectively. This is why the “attend left” signals are distinctly different from the “unattended right” signals, for example. C and D show the full topographical distribution of the 4 most strongly entrained harmonics for 1.3 Hz stimuli and 1.5 Hz stimuli separately. Bilateral entrainment is readily visible in the attended signals. The harmonics are organized by rows and the attended/unattended signal for left/right hemifield stimuli are organized by columns.