
Figure 4.
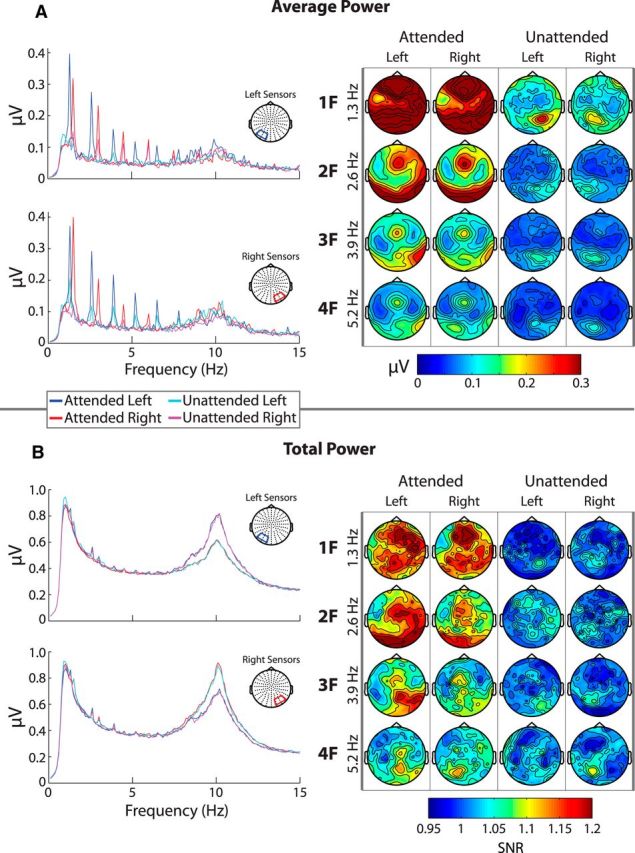
Power modulation of the entrainment response. A, Left, Spectral distributions of average power (FFT after averaging across trials) from 0.1 to 15 Hz for left and right sensor groups. The same color scheme is used in these spectra as in the previous figure (blue = attended left; red = attended right; cyan = unattended left; magenta = unattended right). Data from only one stimulus configuration is shown. A, Right, Topographical distributions of average power for the first four harmonics (rows) and for the attended and unattended signals to left and right hemifield stimuli (columns). Only data from 1.3 Hz stimuli are shown. Average power shows similarly strong modulations to those of PLV. B, Total power (FFT on single trials before averaging) of the entrainment response organized in the same manner as A. Here, topographies are expressed in terms of SNR computed by taking the ratio between power at a frequency of interest and the average power between the neighboring frequency bins on either side of it (±0.1 Hz). Note that, although similar topographical distributions can be seen, modulation was drastically weaker. Also note the strong lateralization in the alpha-band that can be seen in the total power spectrum. This is analyzed in a later section.