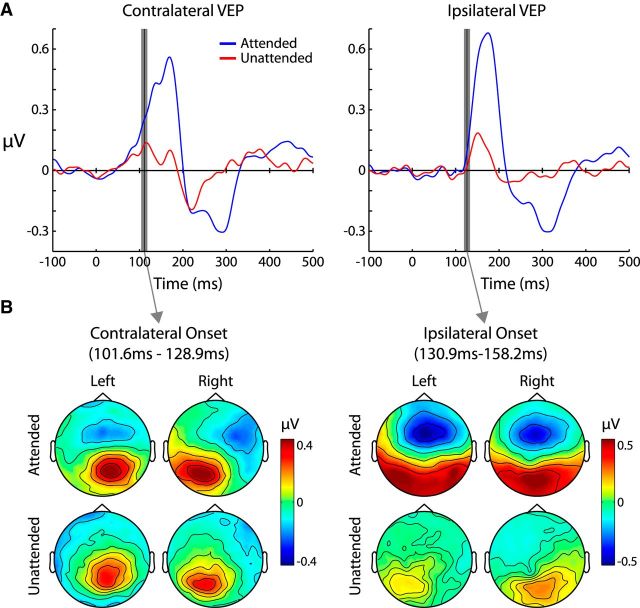
Figure 7.
VEP waveforms and topographies. A, Averaged VEP waveforms (to each checkerboard reversal) for contralateral and ipsilateral sensors collapsed across all other factors. Gray bars indicate the early (left plot) and late (right plot) time periods that were used for statistical analysis and topography plotting. The gray bars are centered at the significant onset time of the attended waveform, which was defined as the 10th consecutive time-point (∼20 ms) that was significantly >0 (paired t test, p < 0.05). B, Amplitude topographies averaged across the early (left) and late (right) time periods. In the late time window, bilateral spreading can be seen in the attended VEP, but not the unattended.

