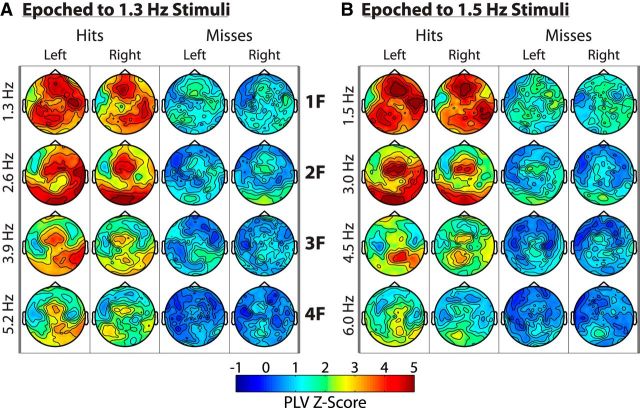
Figure 8.
Entrainment influences task performance. A, B, Z-score topographies of PLV are shown for hit and miss trials (columns) at the first four harmonics (rows). A strong reduction in the entrainment response can be seen for miss trials across all harmonics. A and B are divided by stimulus frequency, as in previous figures.

