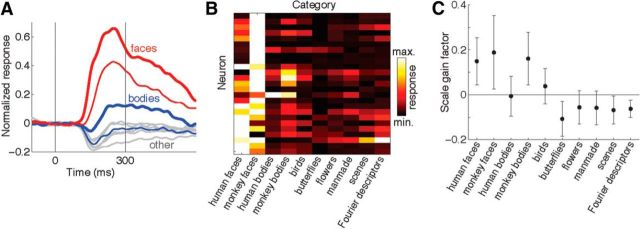
Figure 8.
Category selectivity of AF neurons assessed with static images. A, Normalized population firing rate histograms for 25 AF neurons with positive responses. Red lines indicate mean population responses to monkey faces (thick line) and human faces (thin line). Blue lines indicate mean population responses to images of whole monkey bodies (thick line) and whole human bodies (thin line). Gray lines indicate responses to six other stimulus categories: birds, butterflies, flowers, man-made objects, scenes, and Fourier descriptors. B, Heat map showing mean responses of the same 25 neurons to the 10 stimulus categories. The color of each pixel indicates the mean response of single neuron evoked by all the stimuli within each category based on spikes counted within an 80–300 ms window after stimulus onset. C, Category dependency of image scale gain factor. The y-axis values indicate change in neuronal response in normalized (z-transformed) units per octave change in stimulus size. For categories with positive gain factors (such as faces and monkey bodies) larger stimuli induce stronger neuronal responses, whereas for categories with negative gain factors larger stimuli induce weaker responses.

