Figure 7.
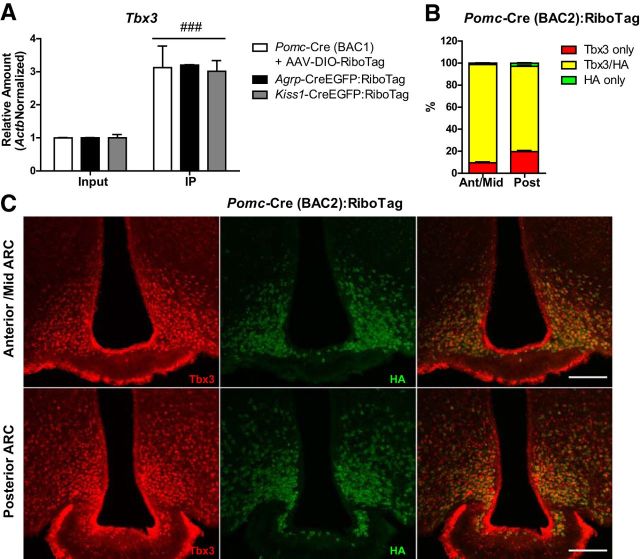
Pomc-derived ARC neurons express the transcription factor Tbx3. A, qRT-PCR analysis for Tbx3 in inputs and IPs of Pomc-Cre(BAC1) mice injected with AAV-DIO-RiboTag and Agrp-CreEGFP:RiboTag and Kiss1-CreEGFP:RiboTag mice. Graph shows the mean ± SEM. Statistical analysis was performed using two-way ANOVA followed by Bonferroni post-tests. ###p < 0.001. B, Quantification of immunofluorescence analysis for Tbx3 and HA in the anterior/middle (−1.34 to −1.94 mm from Bregma) and posterior ARC (−1.94 to −2.46 mm from Bregma) of Pomc-Cre(BAC2):RiboTag mice. Data are presented as the average percentage of Tbx3-only (red), HA-only (green), and Tbx3/HA double-stained (yellow) cells in 30-μm-thick sections every 180 μm. Graphs show the mean ± SEM of the combined results from two mice. C, Representative images showing the presence of Tbx3-positive nuclei in HA-labeled cells in the anterior/mid and posterior ARC of Pomc-Cre(BAC2):RiboTag mice. Scale bars: 100 μm.

