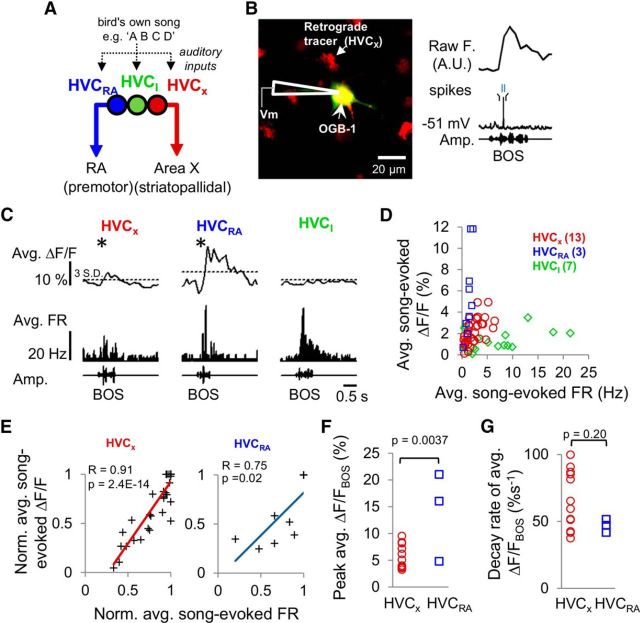
Figure 1.
Calcium signals in HVC PNs are correlated with action potential activity in anesthetized zebra finches. A, HVC contains several distinct cell types that are spatially intermingled and synaptically interconnected, all of which receive auditory input from extrinsic sources. HVCRA and HVCX cells send long-range axonal projections to the robust nucleus of the arcopallium (RA) and the striatopallidal region Area X, respectively, whereas axons of inhibitory HVC interneurons (HVCI cells) are restricted to HVC. B, Left, A 2p image showing a retrogradely labeled HVCX cell filled with the calcium-sensitive dye OGB-1 (green) via a sharp electrode recording pipette. HVCX cells were identified by retrograde labeling from Area X with AlexaFluor-594 dextran (red). Right, Intracellular fluorescence and membrane potential traces obtained from simultaneous calcium imaging and intracellular recording of an HVCX cell during auditory playback of the BOS. C, Average somatic calcium responses (ΔF/F) and average FR PSTHs (10 ms bin) evoked by BOS playback in three different HVC cell types: HVCX cell (left), HVCRA cell (middle), and HVCI cell (right). Horizontal dashed line indicates 3 SDs of the baseline period measured before stimulus playback. *Significant responses. D, Average song-evoked ΔF/F plotted against average song-evoked firing rates for all three cell types (HVCX: n = 13; HVCRA: n = 3; HVCI: n = 7). E, Normalized auditory-evoked calcium responses were positively correlated with normalized average auditory-evoked firing rates in HVCX cells (left, r = 0.91, p = 2.4E-14, linear regression) and HVCRA cells (right, r = 0.75, p = 0.02). Lines indicate linear fits. F, Mean peak BOS-evoked calcium responses of HVCRA cells were significantly larger than those of HVCX cells (HVCX: 5.6 ± 0.6%; HVCRA: 14.0 ± 4.8%; mean ± SEM, two-tailed t test, p = 0.00037). G, Decay rates of peak BOS-evoked calcium signals were not significantly different between the two PN types (HVCX: 64.3 ± 6.1%s−1; HVCRA: 46.8 ± 2.8%s−1; mean ± SEM, p = 0.20, two-tailed t test).

