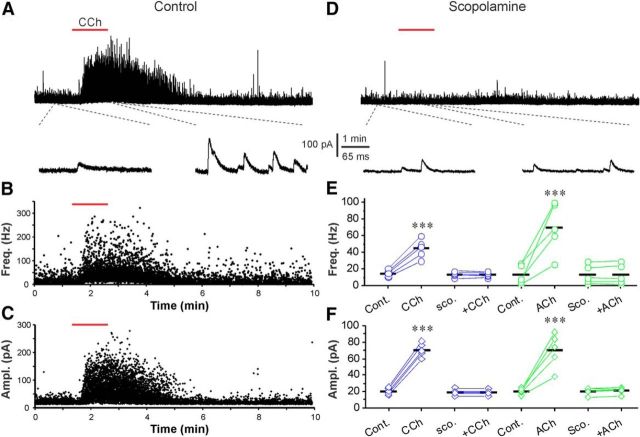
Figure 5.
Activation of mAChRs enhances mIPSCs in ETCs. A, Top, Voltage-clamp trace showing that bath-applied CCh (20 μm, red bar) enhances mIPSCs when the ETC was held at 0 mV in the presence of NBQX (10 μm), APV (50 μm), and TTX (1 μm). Bottom, Blow up from the top trace showing changes in mIPSCs before and after CCh administration. B, C, Scatter plots from the top trace in A showing that both frequency (Freq.; B) and amplitude (Ampl.; C) of mIPSCs were enhanced by CCh. D, Voltage-clamp traces from the same cell in A showing that the CCh-induced enhancement of mIPSCs was completely blocked by bath-applied scopolamine (scop.; 10 μm). E, F, Quantification data from five cells showing that either CCh or ACh (200 μm) enhances both the frequency (E) and amplitude (F) of mIPSCs in all tested ETCs, and that these effects were completely eliminated by scopolamine. Repeated-measures ANOVA was performed in E. ***p < 0.001. Cont., Control.

