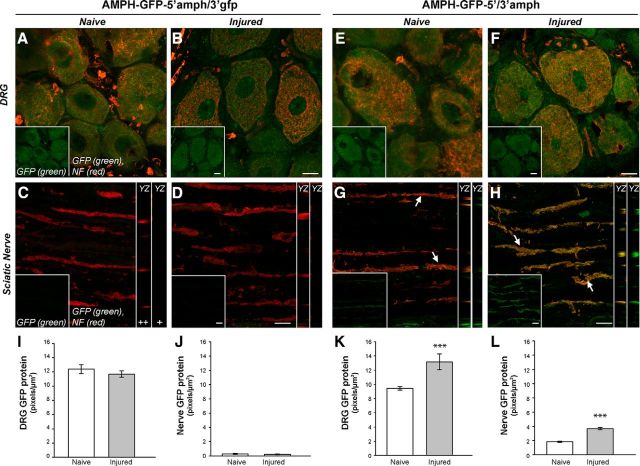
Figure 5.
Amphoterin 3′-UTR is needed for axonal localization in vivo. A–H, Representative, exposure-matched confocal images of L4–L5 DRGs and distal sciatic nerve for animals transduced with LV encoding amphoterin-GFP fusion protein plus 5′-UTR of amphoterin and 3′-UTRs of GFP or amphoterin are shown [AMPH-GFP-5′amph/3′gfp (A–D) and AMPH-GFP-5′/3′-amph (E–H), respectively), with NF protein in red and GFP in green. All samples are 14 d post-LV transduction of L4–L5 nerve roots; naive (A, C, E, G) and 7 d after sciatic nerve crush (B, D, F, H) samples are shown. The top shows confocal XYZ images of L4–L5 DRGs, with merged channels in main panel and GFP signal only in the insets; bottom shows XYZ projections of sciatic nerve as merge of GFP and NF signals in the main panels and GFP only in the inset (lower left of each panel). YZ orthogonal projections of GFP + NF (++) and GFP only (+) are shown as strip images adjacent to each sciatic nerve image in C. GFP signals are seen in the DRGs cell bodies expressing either AMPH-GFP-5′amph/3′gfp (A, B) or AMPH-GFP-5′/3′-amph (C, D). However, the sciatic nerve only shows GFP signals in AMPH-GFP-5′/3′-amph-expressing animals (arrows), with a clear increase after nerve crush injury (G, H) Scale bars: DRG panels, 25 μm; sciatic nerve panels, 10 μm; orthogonal projections are at same scale as main panels. I–L, Quantification of GFP signal intensity is shown for DRG (I, K) and sciatic nerves (J, L) for AMPH-GFP-5′amph/3′gfp-expressing animals (I, J) and AMPH-GFP-5′/3′-amph-expressing animals (K, L). Values represent mean intensity ± SEM from images matched for exposure, gain, offset, and after processing (n ≥ 30 from at least three separate experiments; **p ≤ 0.01; ***p ≤ 0.001 by Student's t test).

