Figure 5.
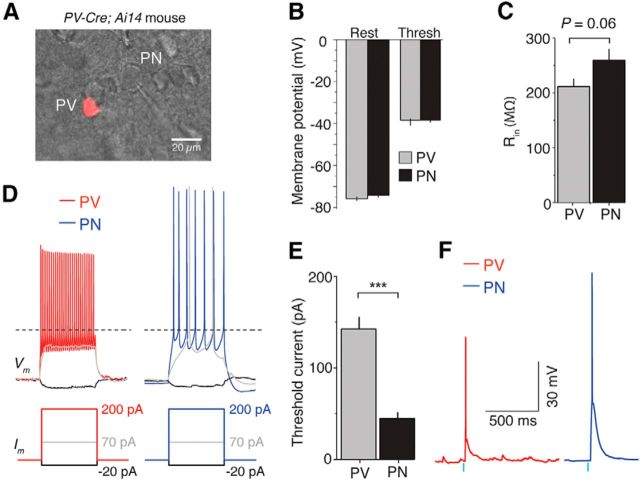
Intrinsic properties of PNs and PV INs in layer 3 of dACC. A, Differential interference contrast image overlaid with fluorescence image showing a tdTomato-expressing PV IN and a neighboring PN recorded in layer 3 of dACC. B, Resting potential (Vrest) and spike threshold (Vthresh) were similar across cell types (Vrest, p > 0.05, t test; Vthresh, p > 0.05, Mann–Whitney U test). C, There was a trend toward PNs exhibiting higher input resistance than PV INs (p = 0.06, t test). D, Representative traces of PV and PN responses (top) to injected currents (bottom). E, PV INs required larger current injection to reach spike threshold than PNs. ***p < 0.001. F, Sample traces showing that PVs and PNs fire action potentials in response to photostimulation (0.5 ms; indicated by blue bars) of ChR2-expressing axons originating from the MD. Similar results were obtained from 5 PV INs and 5 PNs. Threshold data are presented as median ± interquartile range in B; other data are presented as mean ± SEM.

