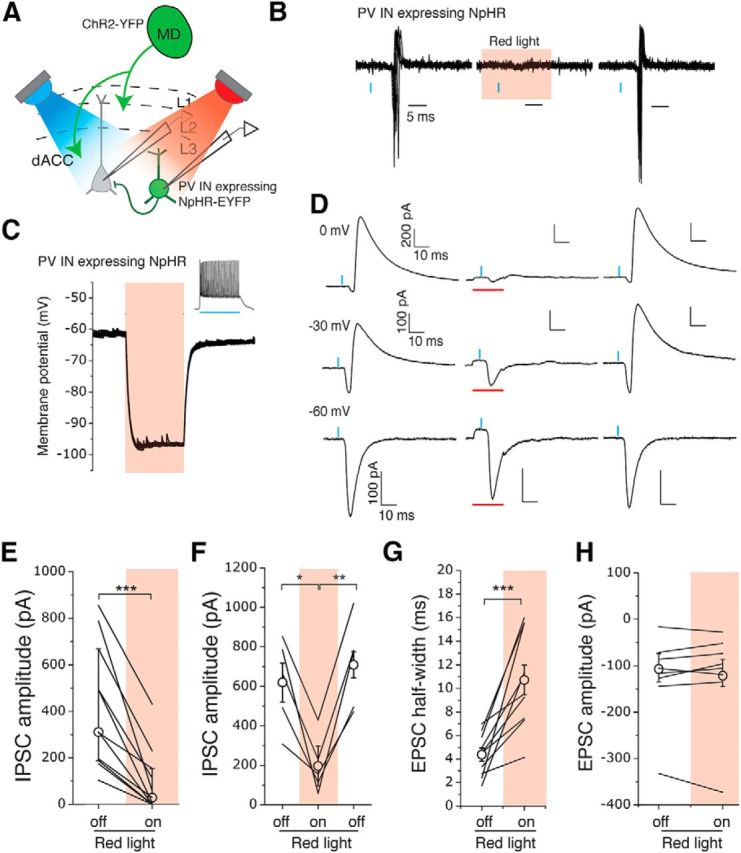
Figure 7.

PV INs mediate MD-driven feedforward inhibition in the dACC. A, Schematic of the experimental approach. A blue light (λ = 470 nm) and a red light (λ = 625 nm) were used to activate ChR2 and eNpHR3.0, respectively. B, Sample traces of action potentials recorded in cell-attached mode from a PV IN expressing eNpHR3.0 in response to photo-activation of MD inputs with blue light pulses (blue bars), before, during, and after the presentation of red light (red shading) to activate eNpHR3.0. Red light was triggered 5 ms before the onset of the 0.5 ms blue light pulse and illuminated continuously for 20 ms. C, Photostimulation caused potent hyperpolarization in PV INs expressing eNpHR3.0. Inset, The 500 ms blue light pulse induced fast spiking in an eNpHR3.0-expressing PV IN. D, Sample traces of synaptic currents recorded from layer 3 PNs in the dACC in response to photostimulation (blue bars) of inputs from the MD, before, during, and after the presentation of red light (red bars) to inhibit PV INs. The presentation of red light reversibly suppressed the MD-driven IPSCs recorded at either 0 mV or −30 mV holding potential. E, The peak amplitude of MD-driven IPSCs recorded from PNs at 0 mV was significantly reduced when PV INs were silenced. ***p < 0.001 (Wilcoxon matched-pairs signed-rank test). F, Silencing PV INs reversibly suppressed the MD-driven IPSCs. *p < 0.05 (one-way repeated-measures ANOVA followed by Tukey's test). **p < 0.01 (one-way repeated-measures ANOVA followed by Tukey's test). G, H, Silencing of PV INs increased the half-width (***p < 0.001, paired t test) (G) but did not affect the amplitude (p > 0.05, Wilcoxon matched-pairs signed rank test) (H) of MD-driven EPSCs recorded in PNs at −30 mV holding potential. E, H, Data are median ± interquartile range. All other data are mean ± SEM.
