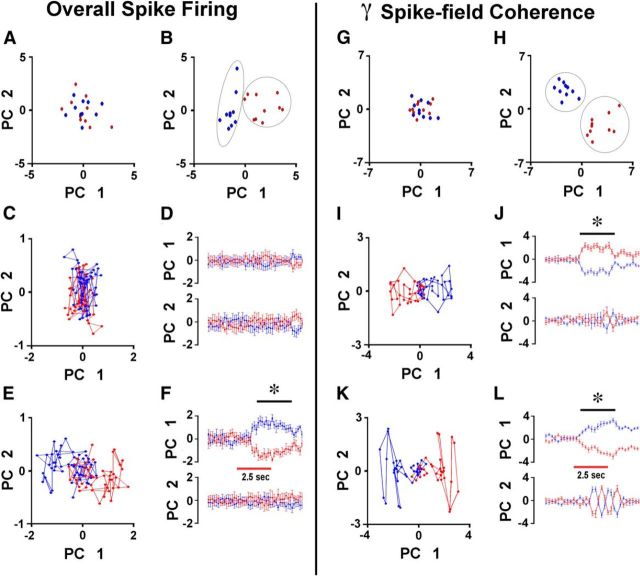
Figure 9.
A–L, PCA of the spike odor responses (A–F) and ϒ spike-field coherence responses (G–L) calculated using data from all the forward go–no go sessions. PCA was evaluated in all trials within the first block (A, C, D, G, I, J) or for a block in the middle of the session (B, E, F, H, K, L). A, B, G, and H show all the first and second PCA scores (PC1 and PC2) for an example of one of the time intervals before (A, G) or during (B, H) the addition of odor in a middle block. C, E, I, and K show the means for the two PC scores calculated at time intervals before and after the addition of odor within a trial during the first block (C, I) or the middle block (E, K). D, F, J, and L show the averages (±SEM) for the first two scores as a function of time within a trial during the first block (D, J) or the middle block (F, L; one-way ANOVA for PC1 in overall spike firing, D, F(1,378) = 3.4, p > 0.05; F, F(1,378) = 482, p < 0.001; one-way ANOVA for PC1 in ϒ spike LFP coherence, J, F(1,218) = 597, p < 0.001; F, F(1,218) = 864, p < 0.001).

