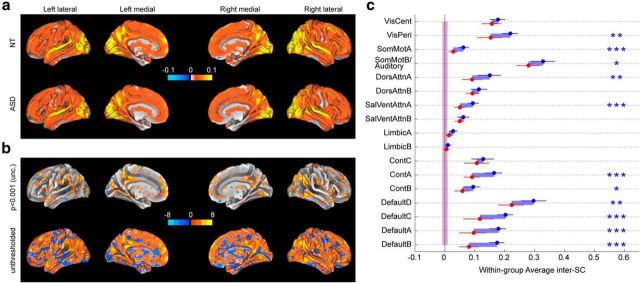
Figure 2.
Within-group inter-SC while watching an episode of the American sitcom “The Office”. a, Voxelwise within-group inter-SC for 20 NT subjects (top) and for 17 ASD subjects (bottom), projected on the inflated brain using Caret's Conte69 atlas. Note that the highest correlation values are >0.3; however, the scale is limited to ±0.1 (and unthresholded) for visualization purposes. b, Voxelwise T values for the difference in within-group inter-SC between 20 NT subjects and 17 ASD subjects; both a loosely thresholded (p < 0.001 uncorrected) and an unthresholded map are shown to represent available information as faithfully as possible. c, within-group inter-SC for 20 NT (blue) and 17 ASD (red), based on time courses in 17 functional networks. Error bars are 95% confidence interval based on a bootstrap estimate of the mean of five subjects. The shaded areas around zero represent the 95% confidence interval for the distribution of group inter-SCs that would arise by chance, for each group. Statistics for the network analyses are FDR-controlled (***q < 0.001, **q < 0.01, *q < 0.05). See Figure 1b for the networks.

