Figure 5.
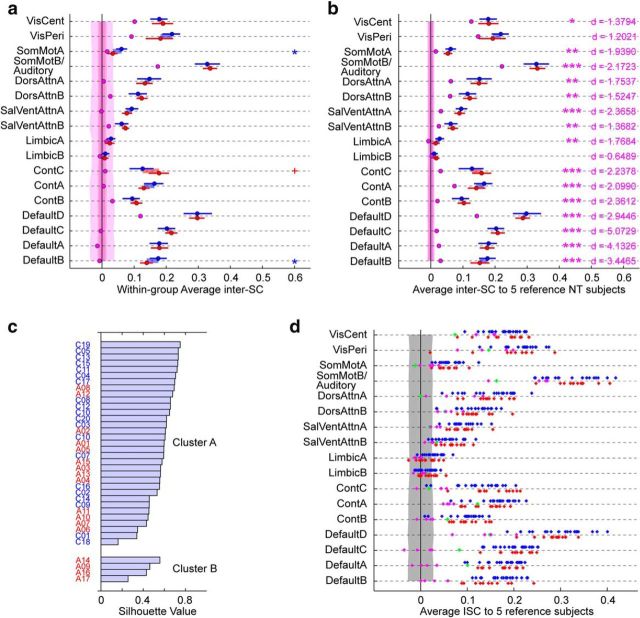
Characterization of the idiosyncratic brain activity of the five distinct ASD subjects. a, Within-group inter-SC after exclusion of the five identified ASD subjects, with these five subjects treated as their own subgroup (in pink; NT, blue; remaining ASD, red). Error bars are 95% confidence interval based on a bootstrap estimate of the mean of five subjects. The shaded areas around zero represent the 95% confidence interval for the distribution of group inter-SCs that would arise by chance, for each group. Significance for the difference between the ASD and NT groups is denoted with blue or red symbols, depending on the sign of the difference (FDR-controlled: *q < 0.05, +q < 0.1). b, Group-averaged inter-SC to a reference group of five NT subjects, after exclusion of the five distinct ASD subjects, with these five subjects treated as their own subgroup (in pink; NT, blue; remaining ASD, red). Error bars are 95% confidence interval based on a bootstrap estimate of the mean of five subjects. The shaded areas around zero represent the 95% confidence interval for the distribution of group inter-SCs that would arise by chance, for each group. No significant difference between the NT and ASD groups was found. In pink, significance for the difference between the five identified ASD subjects and the remaining subjects (pooling NT and remaining ASD together), with Cohen's d effect size; statistics are FDR-controlled (***q < 0.001, **q < 0.01, *q < 0.05, +q < 0.1). c, k-means clustering solution based on the inter-SC of each subject to a reference group of five NT (averaged over 1000 random draws) in each of the 17 functional networks, using a Pearson-correlation based distance measure. The best partition is into two clusters (data not shown), with one cluster comprising four of the five previously identified ASD subjects. d, Inter-SC to a group of 5 reference NT subjects shown for individual subjects. NT subjects are in blue, ASD subjects in red with the exception of the five distinct ASD subjects who are in pink (4/5) and green (A01, whose spatial pattern of idiosyncrasy did not cluster with that of the other idiosyncratic ASD subjects). The shaded area represents the 95% confidence interval for the distribution of individual inter-SCs that would arise by chance. See Figure 1b for the networks.

