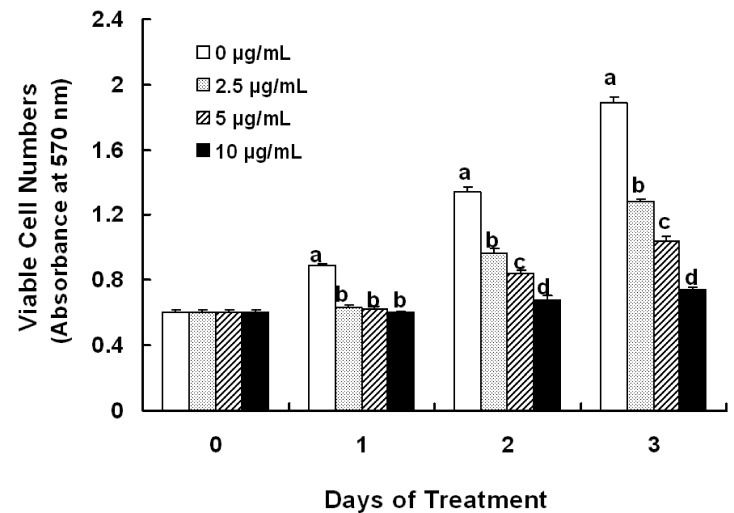
Fig. 2. Effect of EEIO on HT-29 cell growth.
HT-29 cells were plated in 24-well plates at a density of 50,000 cells/well in DMEM/F12 supplemented with 10% FBS. One day later, the monolayers were serum-starved with serum-free DMEM/F12 supplemented with 5 mg/L transferrin, 0.1 g/L BSA, and 5 µg/mL selenium for 24 h. After serum starvation, cells were incubated in serum-free medium in the absence or presence of various concentrations of EEIO. Cell numbers were estimated by MTT assay. Each bar represents the mean ± SEM (n = 6). Bars with different letters are significantly different at P < 0.05 by Duncan's multiple range test at each time point.

