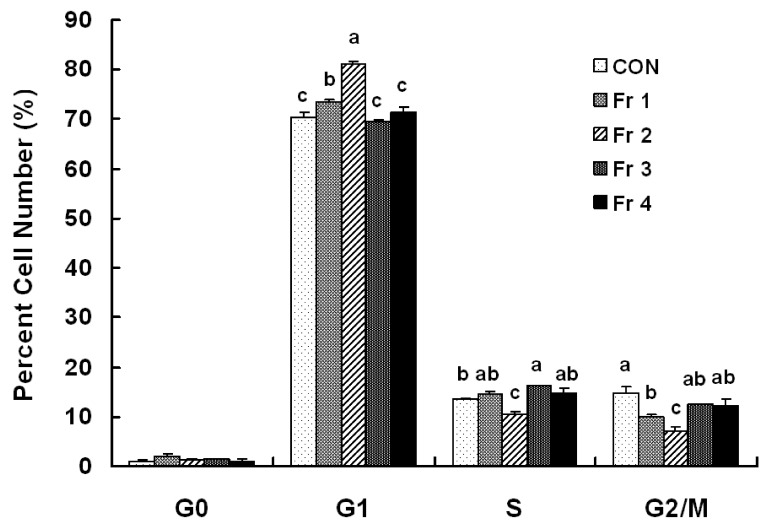
Fig. 8. Effects of various fractions of EEIO on cell cycle progression in HT-29 cells.
Cells were plated and treated with various fractions for 2 days as described in Fig. 2. Cells were trypsinized and collected. Cells were then fixed and digested with RNase, after which cellular DNA was stained with propidium iodide and analyzed by flow cytometry. Each bar represents the mean ± SEM (n = 6). Bars with different letters are significantly different at P < 0.05 by Duncan's multiple range tests.

