
Table 4. Comparison of the groups' Food consumption and Nutrient intakes.
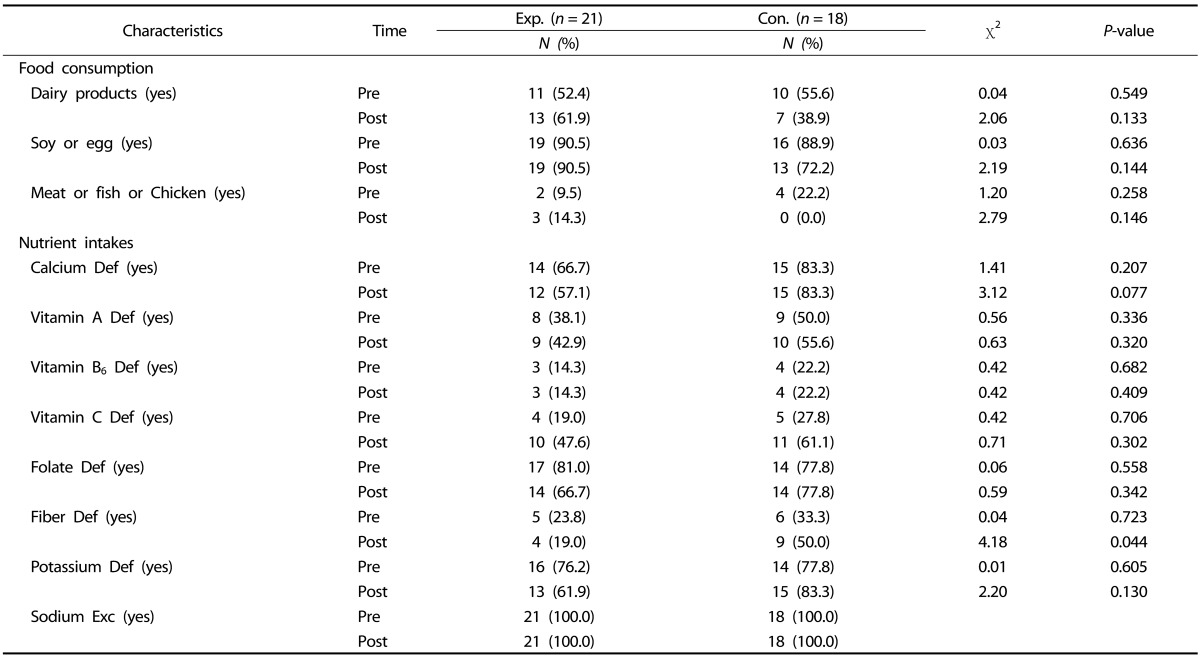
Exp = experimental group; Con = control group; Def = deficiency; Exc = Excess.
Official websites use .gov
A
.gov website belongs to an official
government organization in the United States.
Secure .gov websites use HTTPS
A lock (
) or https:// means you've safely
connected to the .gov website. Share sensitive
information only on official, secure websites.
Exp = experimental group; Con = control group; Def = deficiency; Exc = Excess.