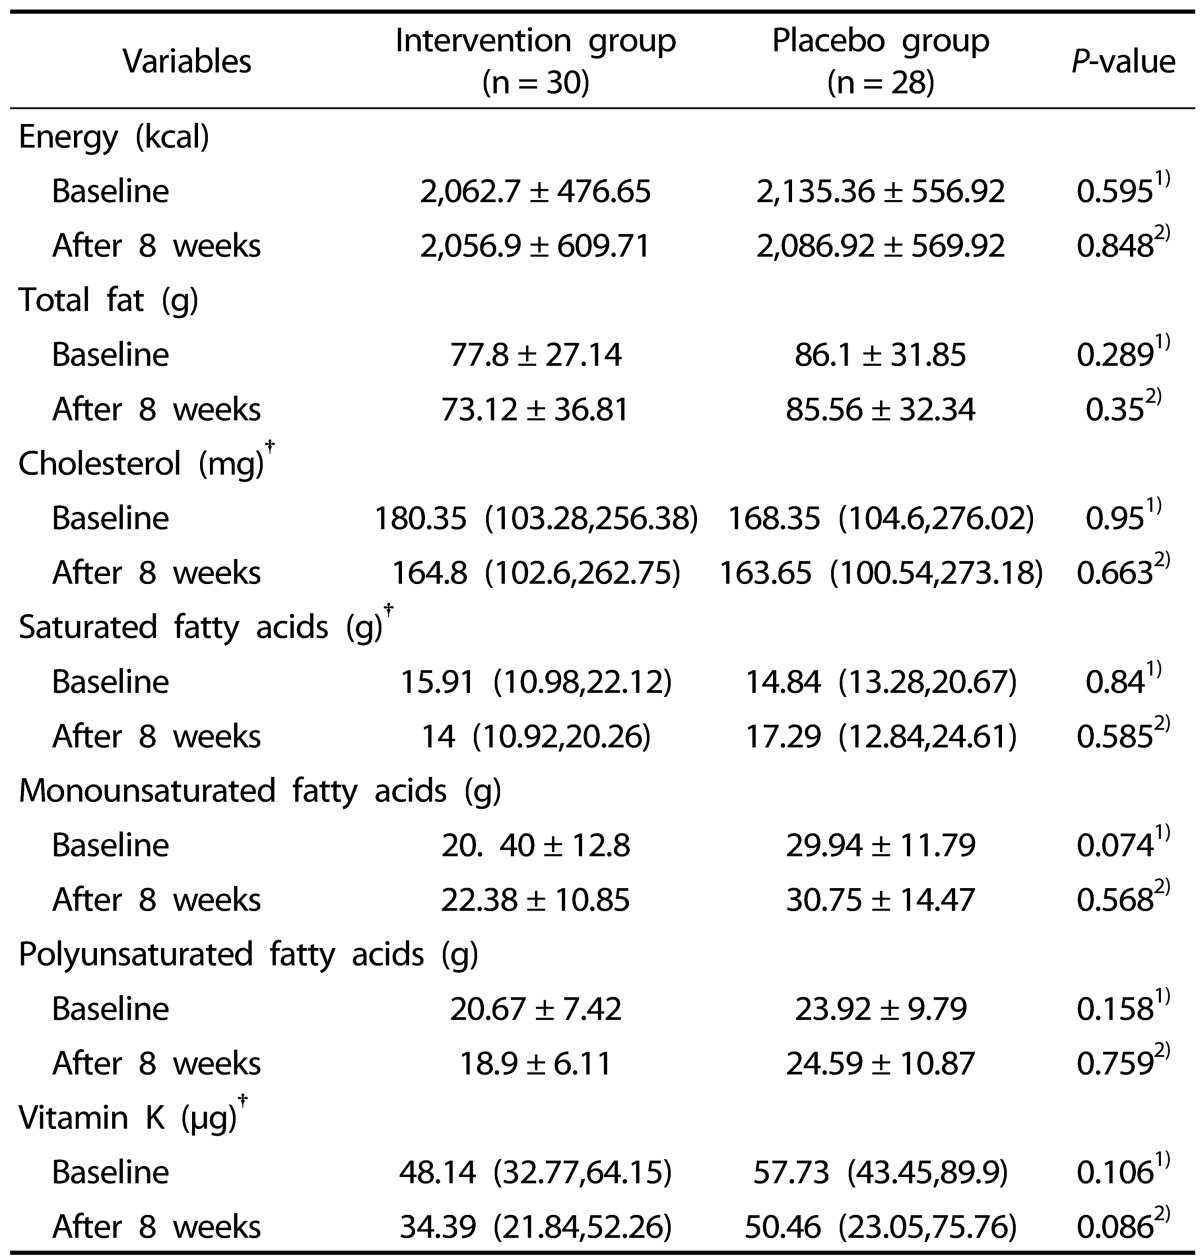
Table 2. Daily dietary intakes in women with RA at baseline and after 8 weeks in both groups.

Data are presented as mean ± SD for normally distributed variables, †median (percentile 25, percentile 75) for non normally distributed variables.
1)Compare baseline characteristics between two groups (Mann-Whitney U test for non normally distributed variables and Independent-sample t test for normally distributed variables).
2)Final comparison after intervention period; adjusted for confounders .i.e; duration of RA, energy intake, weight, PT and baseline values (ANCOVA).
