
Table 2. Vitamin E intake and plasma concentrations of tocopherols of 106 adults aged 20-59 years living the Seoul metropolitan area, South Korea.
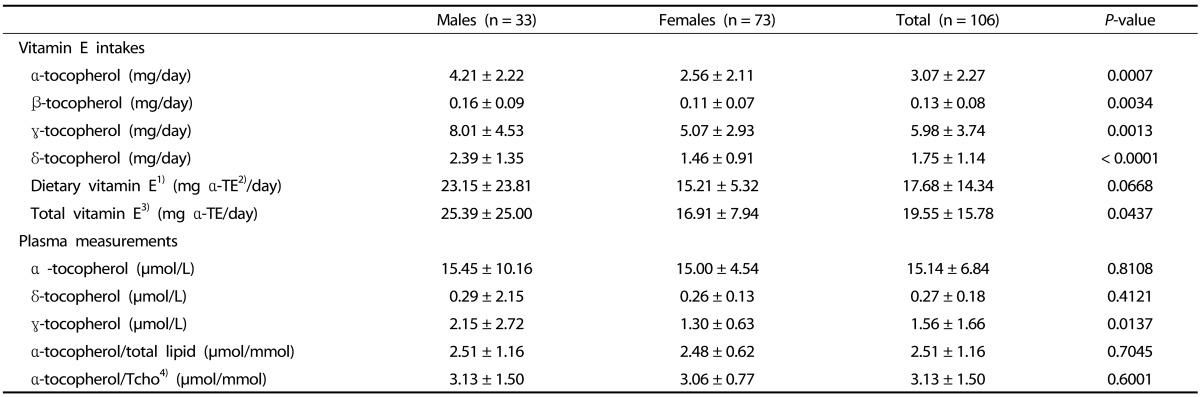
Means ± SD.
*P < 0.05, **P < 0.01, ***P < 0.001
1)Vitamin E from food alone
2)Tocopherol equivalent
3)Dietary plus supplemental vitamin E intake
4)Total cholesterol