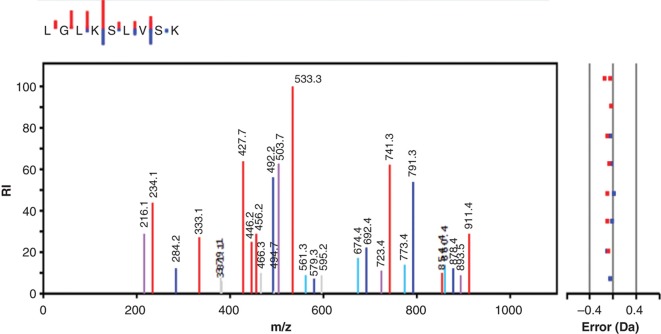
Figure 3.
MS/MS spectrum showing the fragmentation pattern of one of the peptides obtained after trypsin treatment of histone H1 from SignalChem. The y-ion series is shown in red, and the b-ions series is in blue. Also shown is y- and b-ions fitting with the loss of 18 Da in violet and turquoise, respectively. Other observed but unspecified mached ions are grey. The small inset at the top shows only the y- and b-ions, with the length of the staples representing the intensity of the ions.

