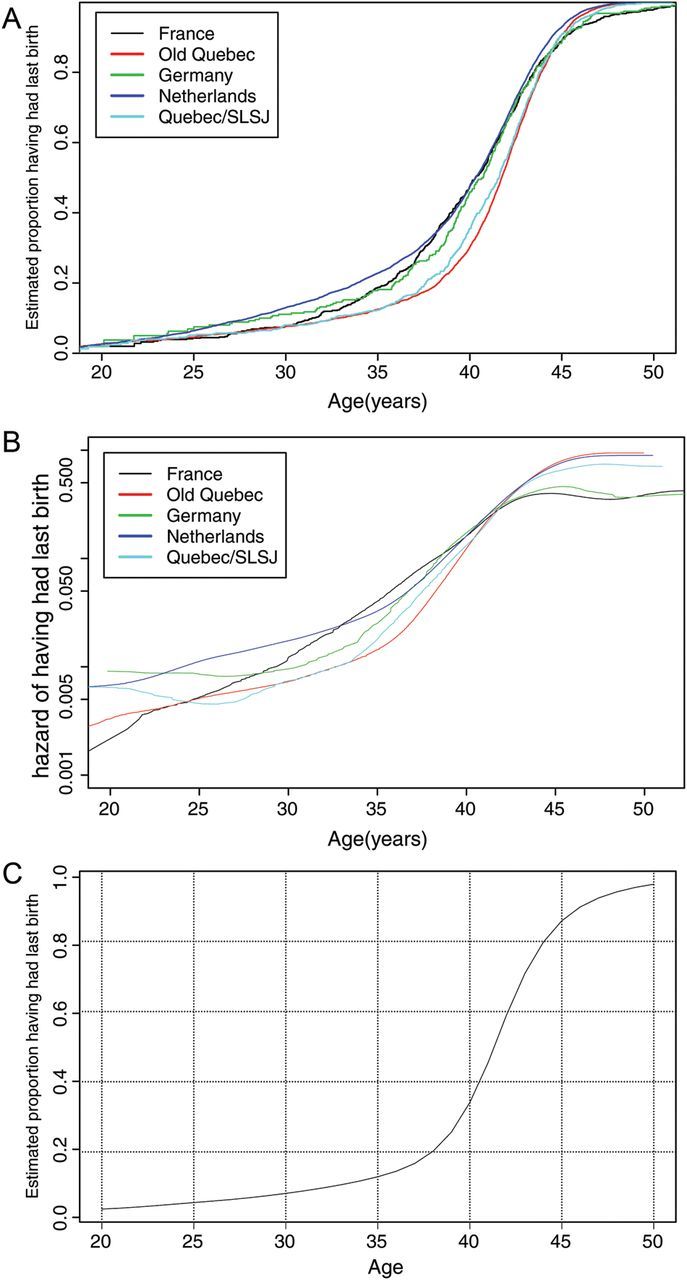
Figure 2.

(A) Cumulative age at last birth (ALB) curves for the oldest birth quartile of the five selected populations. Kaplan–Meier curves using left censoring at age at marriage. (B) Smoothed hazard curves for ALB, for the oldest birth quartile of the five selected populations. (C) The biological ALB curve based on the minimal hazard at each age for the oldest birth quartile of the five selected populations.
