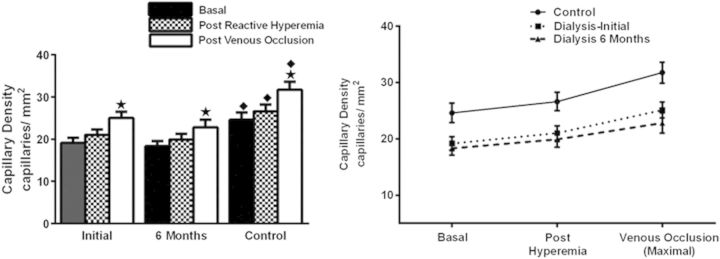
Fig. 1.

CD of HD patients is compared with controls at initiation and 6 months later. Response to stimulation from basal levels to post-arterial occlusion reactive hyperemia to maximal stimulation with venous occlusion is shown. Stars: significantly greater than basal within each group, P < 0.01. Closed diamonds: significantly greater than HD patients at each level from basal to maximal stimulation, P < 0.01
