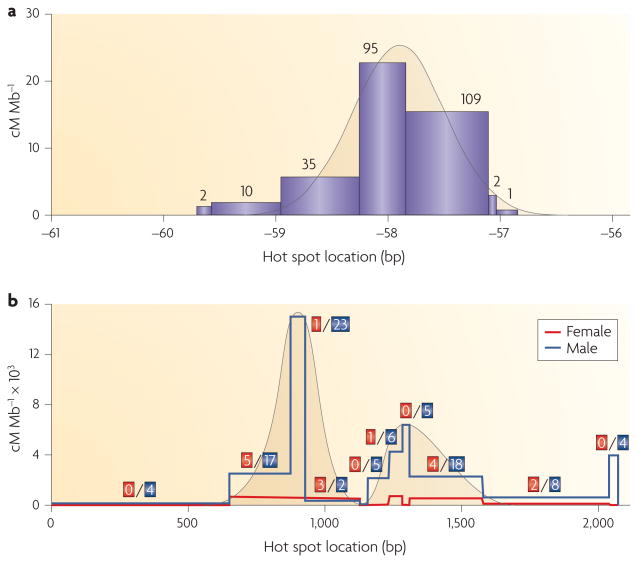
Figure 3. Distribution of crossover exchange points in hot spots.
a | Sperm crossover (CO) distribution across the NID1 hot spot. The COs were recovered from a total of 980,000 amplifiable molecules in the sperm DNA of two men. The intervals are defined by SNP markers, and the number of COs is shown above each interval. Exchange sites of crossing over form a single normal distribution, b | Distribution of COs at the Hlx1 hot spot in 6,000 progeny of female and male B6×CAST F1 mouse hybrids. The number of COs in female (red) and male (blue) meiosis is shown above each interval. Exchange sites of crossing over form two overlapping distributions. Part a is modified, with permission, from Nature Genetics REF. 18 © (2005) Macmillan Publishers Ltd. All rights reserved. Part b is modified from REF 32.

