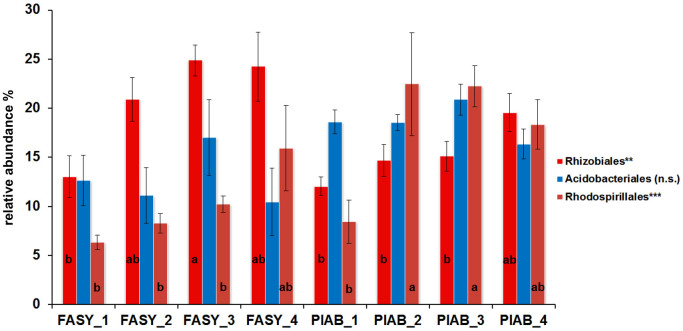
Figure 2. Relative abundances of the three dominant phylogenetic groups (bacterial orders) in deadwood of the two studied tree species (Fagus sylvatica = FASY, Picea abies = PIAB) in different stages of decay (decay classes 1–4).
Differences between decay classes and tree species were analyzed by employing one-way analysis of variance and Fisher's Least Significant Difference (LSD) post hoc test (ns = not significant, * P < 0.05, ** P < 0.01, *** P < 0.001).

