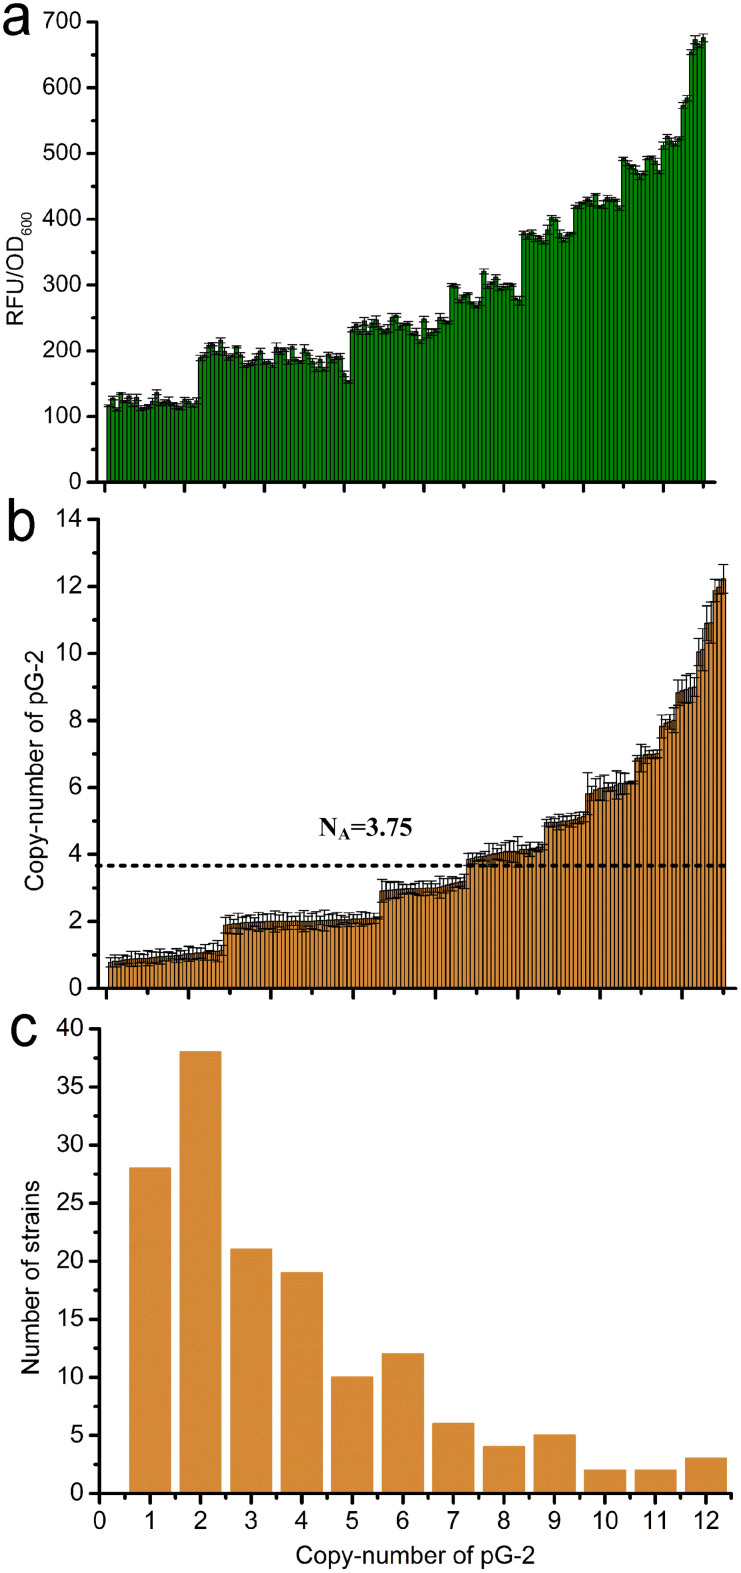
Figure 3. Characterization of the CIGMC system by randomly integrating pG-2 into the chromosome of strain GPF-5.
(a) RFU per OD600 of the 150 CIGMC strains randomly selected. (b) Integrated copy number of pG-2 of the CIGMC strains in Fig. 3a. NA indicates the average integrated copy number. (c) Distribution of the integrated copy number of the 150 CIGMC strains in Fig. 3a. Error bars represent the s.d. (n = 3).

