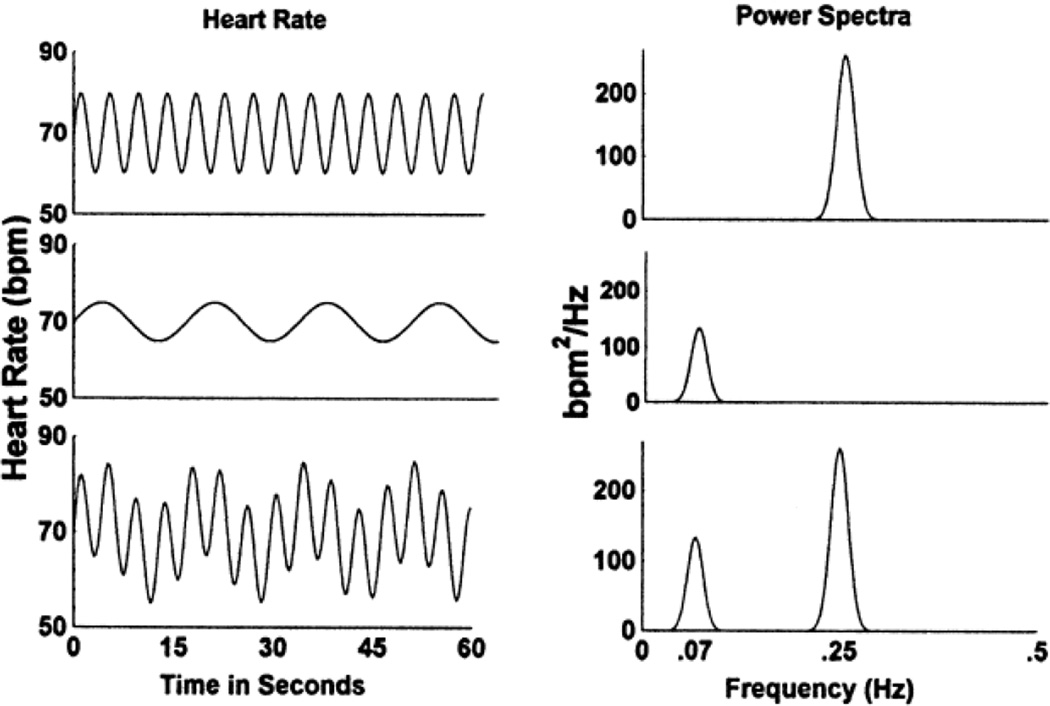
Figure 1.
Fictitious heart rate (HR) signals and associated power spectra. The top two panels represent pure high-frequency HR variability (0.25 Hz), as associated with RSA. The middle two panels represent low-frequency HR variability (0.07 Hz), which is of parasympathetic, sympathetic, diurnal, and nonneural origin. The bottom panels represent the combined signal including both high- and low-frequency components. Actual heart rate signals include spectral power at additional frequencies.

