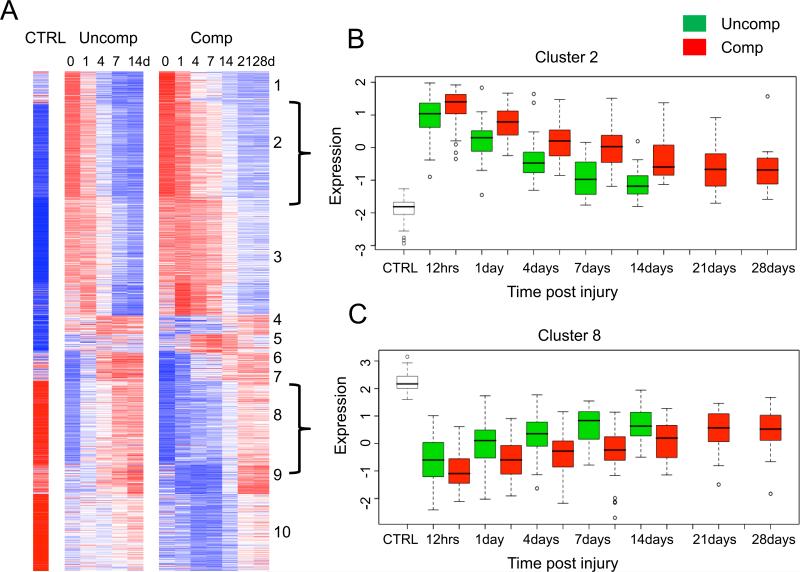
Figure 7.
Differences in gene expression patterns between patients with a complicated and uncomplicated clinical recovery. Heat map of 1,201 genes whose expression was at least twofold different at any time point when compared with controls (CTRL) for patients with a complicated (Comp) or uncomplicated recovery (Uncomp). (A) Cluster analysis of the two cohorts. The brackets to the right of the cluster indicate cluster 2 and 8 shown in B and C, respectively. (B) One cluster of genes whose expression was up-regulated in patients with a complicated recovery. (C) One cluster of genes whose expression was down-regulated in patients with a complicated recovery. © 2011 Xiao et al.5 Originally published in Journal of Experimental Medicine.2011 Nov;208(13):2581-2590. doi: 10.1084/jem.20111354.

