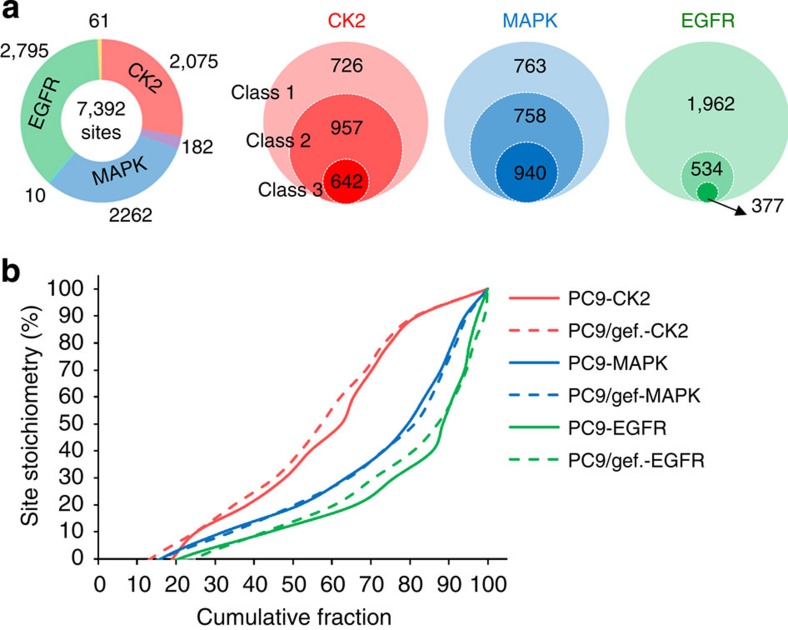
Figure 3. Comparison of phosphorylation stoichiometries between drug sensitive and resistant lung cancer cells.
(a) The number and specificity of identified phosphorylation sites after kinase reaction (Class 1). The identified phosphorylation sites were further filtered by matching to known motifs (Class 2) and known phosphorylation sites registered in multiple public databases (Class 3). (b) Analysis of phosphorylation stoichiometry distribution in motifs matched to EGFR, CK2 and MAPK in drug sensitive (PC9) and resistant (PC9/gef.) lung cancer cells.

