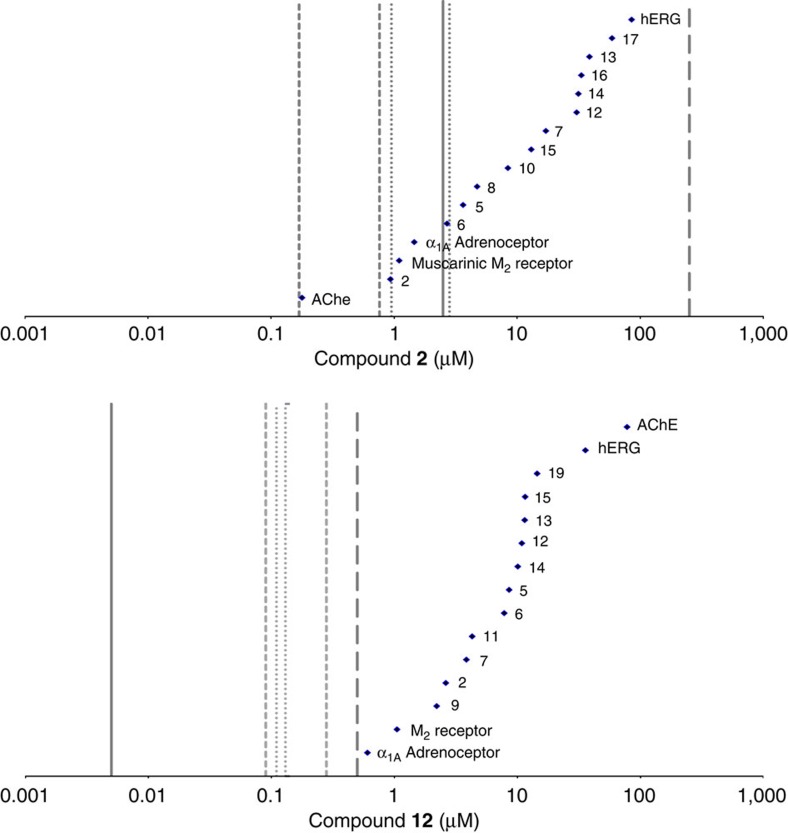
Figure 3. Improvement in safety margins results in the nomination of compound 12 as a clinical candidate.
(a) Secondary pharmacology selectivity plot for compound 2. Selectivity ratio for AChE, α1A and M2 (IC50 against targets (♦)/blood Cmin at ED90 in the Pf/SCID model (solid vertical line) was <1. Free plasma concentration range achieved in rat (dotted lines; Cmin and Cmax) and guinea pig (dashed line; Cmin and Cmax) in vivo illustrates targets covered during toxicity studies, and that selectivity against all targets was less than our target of >100-fold (long dash). (b) Secondary pharmacology selectivity plot for compound 12. Blood Cmin at ED90 in the Pf/SCID model (solid line) is significantly lower than that of compound 2. Success in achieving desired in vitro selectivity illustrated as all off-target potencies (♦) sit to the right of our selectivity target: >100-fold (long dash). Free plasma concentration range achieved in rat (dotted lines; Cmin and Cmax) and guinea pig (dashed line; Cmin and Cmax) in vivo illustrates reduced pharmacological coverage during toxicity studies compared with compound 2, which, in turn, translated into an improved safety margin for compound 12.

