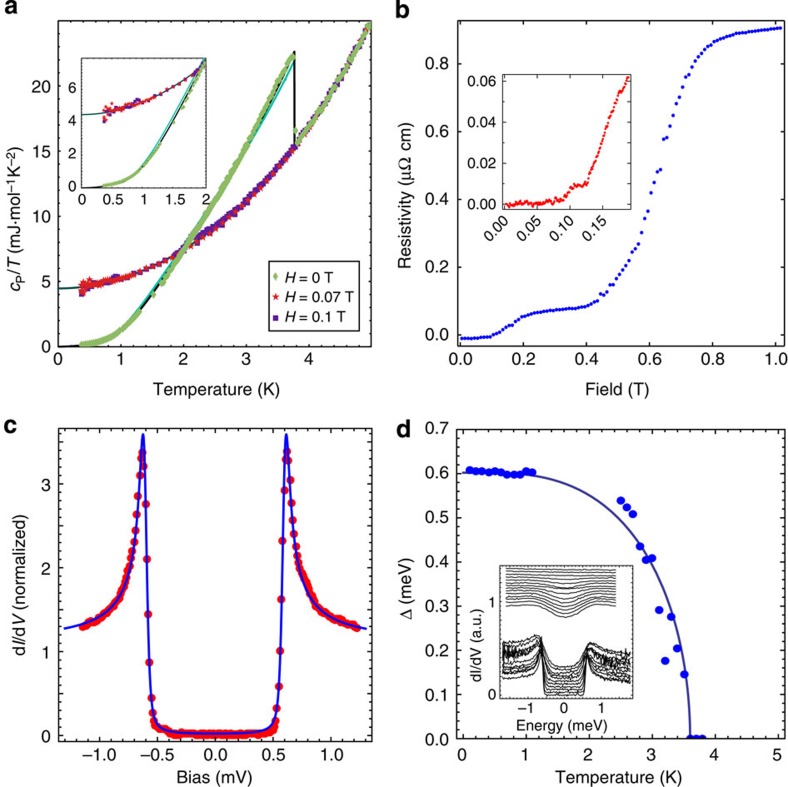
Figure 3. Superconductivity.
(a) Temperature-dependent specific heat for BiPd, the data show the bulk Tc of 3.8 K, no transition is seen at magnetic fields of 70 mT or larger at temperatures down to 400 mK. Only the lowest critical field seen in transport is consistent with the specific heat. Solid green line shows BCS behaviour, solid black line is calculated using the gap obtained from the tunnelling spectra. (b) Transport measurements as a function of magnetic field B performed on the same crystals at 1.4 K. Three transitions are visible when meased at a current I=500 μA at H=0.1, 0.17 and 0.6 T. At higher currents, the two upper transitions disappear, leaving only the lowest one. (c) Tunnelling spectrum of the superconducting state at T=15 mK showing a full gap consistent with isotropic s-wave pairing. The blue line shows the fit of a Dynes function (Is=2.0 nA, Vs=8 mV and Vmod=10 μV). (d) Temperature dependence of the superconducting gap, compared with a fit of mean field theory, inset shows the raw spectra.

