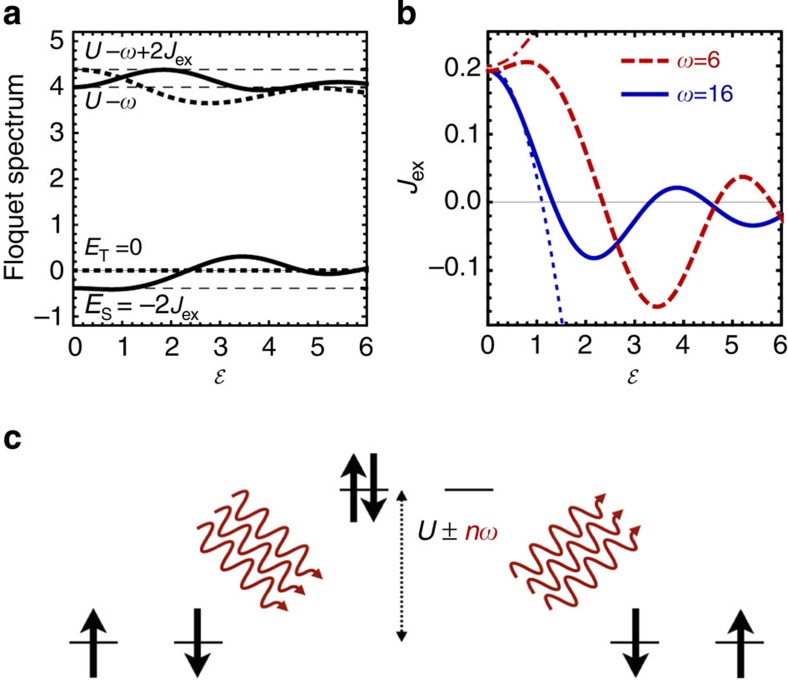
Figure 1. Floquet spectrum of a two-site Hubbard model.
(a) Floquet spectrum for U=10 and ω=6 as a function of Floquet amplitude  . Thin dashed lines indicate the spectrum without driving. The exchange interaction (Jex) is extracted from the difference between the lowest singlet (ES) and triplet (ET) levels. The result is shown in b for the same U=10 and two different frequencies above (ω=16, blue solid line) and below (ω=6, red dashed line) the Mott gap. For large driving strength
  , a reversal of Jex is possible. In addition, thin blue dotted (ω=16) and thin red dash dotted (ω=6) lines indicate the modification of Jex as obtained within second-order perturbation theory. (c) Illustration of the modification of Jex in the Floquet picture. Red wavy lines indicate the virtual absorption and emission of an arbitrary number n of photons with frequency ω. This induces a coupling to excited states in different Floquet sectors displaced by an energy U±nω.

