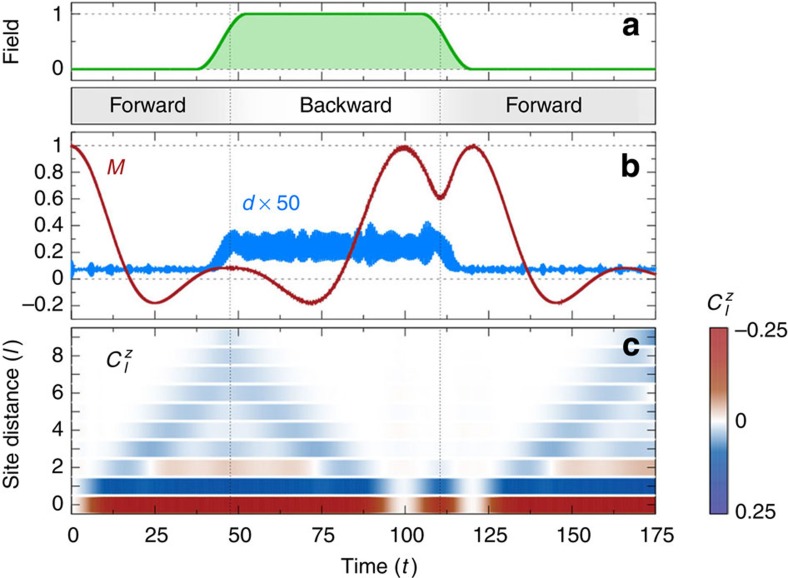
Figure 3. Time reversal of the spin dynamics by periodic driving.
(a) Field envelope with cosine-shaped ramps of length Δt=15 around tf=45 and t=112.5. The bar below the field envelope indicates forward (grey) and backward (white) time evolution when the field is off and on, respectively. (b) Time evolution of staggered magnetization M (red) and total double occupation d (blue), scaled by a factor of 50, of a 10-site Hubbard chain, showing free evolution for times t<37.5 and t>120 and evolution under an additional periodic driving at frequency ω/U=0.6 and Floquet amplitude  in between. (c) Build up and diminishing of the spin–spin correlation function
  . Numerical results were obtained by exact diagonalization for U=50 and open boundary conditions, starting from a classical Néel state. The colour bar indicates the value of
  , ranging from −0.25 (dark red) through 0 (white) to 0.25 (dark blue).

